ExeWatch Now Generates Full Stack Traces for Delphi Win32 and Win64, and Has a New RAD Studio Plugin

🇮🇹 Italiano • 🇪🇸 Español • 🇩🇪 Deutsch • 🇫🇷 Français • 🇧🇷 Português
You have a Delphi or C++Builder project running at your customers' sites and you would like to know what happens to it, but every time you open the SDK page you remember everything there is to configure. With ExeWatch 1.90 I tried to do it all from an IDE menu. Here is what the new setup contains and what I actually tested.
TL;DR: ExeWatch 1.90 has a setup called ExeWatch for RAD Studio that adds a menu to the IDE. From there you turn on telemetry in a Delphi or C++Builder project and receive errors, logs, metrics and timing from your customers. Errors arrive with their stack trace (in Delphi with unit, function and line, on Win32 and Win64) thanks to the symbol map inside the executable. It works from XE8 onward. Below are the steps and the dialogs, and at the end what I actually tested and what I did not.
Try it right now! It is the best gift you can give yourself and your customers, and you can start using it for free, with no time limit. Download ExeWatch for RAD Studio, create a free account on exewatch.com and turn on telemetry in one of your own projects. In the console you immediately see what arrives: logs, metrics, timing and errors with their stack trace.
What’s new in 1.90
For the first time ExeWatch lives inside the IDE. Version 1.90.0 (Delphi SDK 0.25.0) has a single setup and a menu in RAD Studio: pick a menu entry and the project you have open has telemetry on, with the symbol map inside the executable for stack traces. To me this is the release that puts ExeWatch where you are already working, on your project. I show it live at ITDevCon 2026, in Rome on November 19 and 20, and then at EKON too: details at the end.
Download the setup and try it on a project of your own. Below are the steps, one at a time, with the dialogs you will see in the IDE: installation, menu, turning on telemetry and, at the end, a stack trace.
Before you start, watch the whole path in a bit over a minute: new project, ExeWatch enabled from the menu, API key, build, and the stack trace arriving in the console. The video is 1920×1080: to read the details, use the player’s full-screen button.
1. Install the setup
The setup is called ExeWatch for RAD Studio and weighs about 2.9 MB. It installs per user and does not ask for administrator rights. What it does:
- integrates the expert into the IDE of every RAD Studio installed on the machine, from XE8 onward;
- copies the SDK sources;
- installs the command-line tool
ExeWatchMapCLI.exe, the one you use in build scripts and in CI; - sets the
EXEWATCH_SDKenvironment variable, which is what you then find in the Library Path.
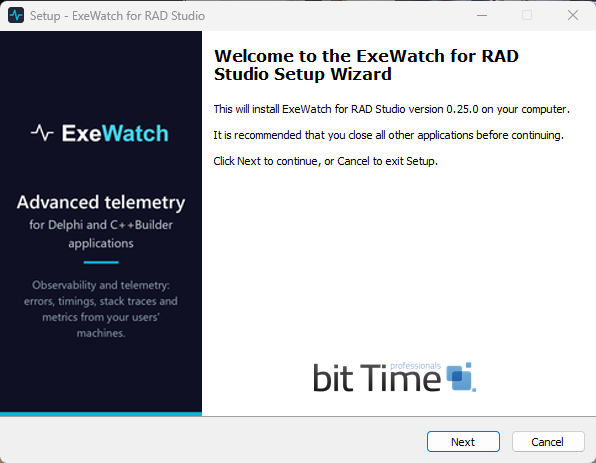
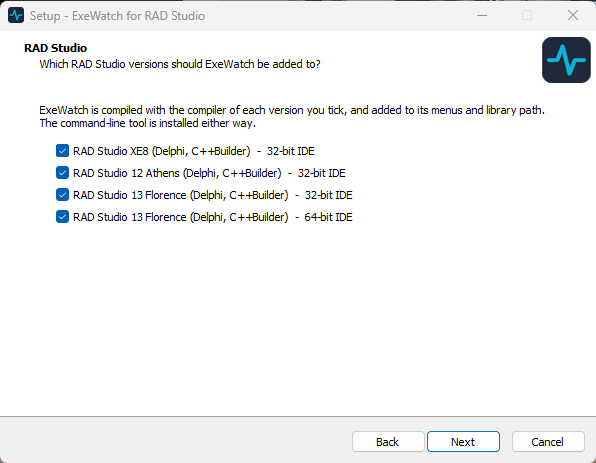
You download it from ExeWatchRADStudioSetup.exe, on the ExeWatch site: the link is also the first step of the “Setup” list in the Delphi section of the home page. If you have a Delphi or C++Builder older than XE8, or you use another language, the home page has the “DLL” tab.
2. Open the ExeWatch menu
Open a project and go to Project > ExeWatch. The same menu is also in the project’s context menu in the Project Manager. It contains three entries.
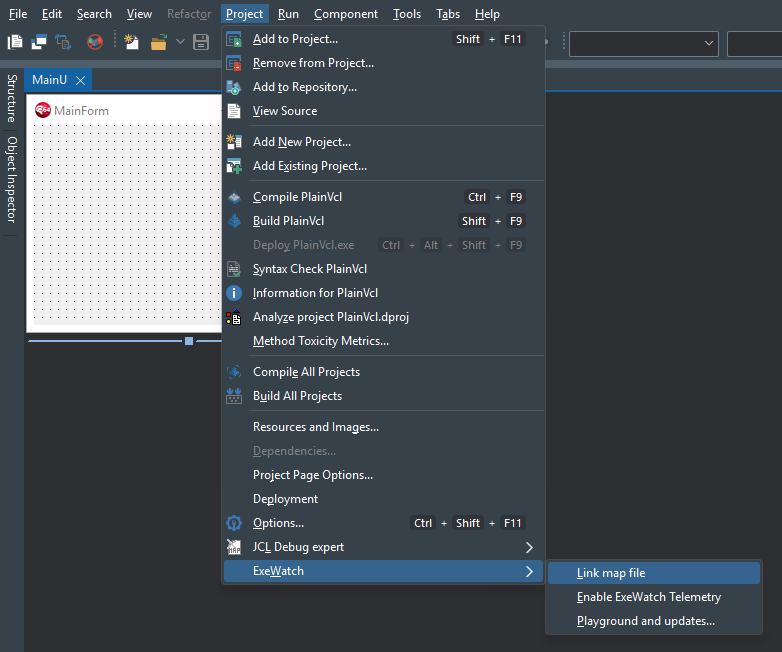
3. Enable ExeWatch Telemetry
This is the entry that saves you the manual work. You pick it, and the expert:
- creates
ExeWatchConfig.pasin the project; - adds the SDK units to the project (
ExeWatchSDKv1, plus the unit for VCL or FMX); - inserts
StartExeWatchandFlushExeWatchin the main file: the.dprin Delphi, the.cppin C++Builder.
At the end a dialog explains what was done. If you want to see what changed in the project files, you have the diff from your version control system.
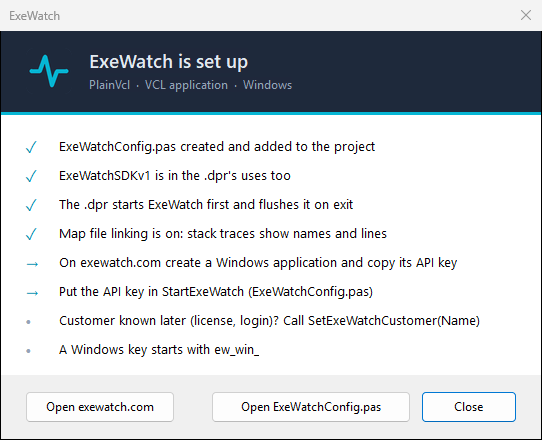
The same dialog also turns on Link map file for that project: we get to it in a moment.
This is the .dpr of a test VCL application (PlainVcl) after the click, in Delphi 13:
program PlainVcl;

uses
  Vcl.Forms,
  MainU in 'MainU.pas' {MainForm},
  ExeWatchConfig in 'ExeWatchConfig.pas',
  ExeWatchSDKv1,
  ExeWatchSDKv1.VCL;

{$R *.res}

begin
  StartExeWatch;
  Application.Initialize;
  Application.MainFormOnTaskbar := True;
  Application.CreateForm(TMainForm, MainForm);
  Application.Run;
  FlushExeWatch;
end.
And this is the line the IDE writes in the Messages window at the next build:
[ExeWatch] PlainVcl.dproj(1): PlainVcl.exe: map linked (51812 symbols)
The API key
In the generated unit you change a single constant: EXEWATCH_API_KEY.
const
  EXEWATCH_API_KEY = 'api-key-from-the-ExeWatch-console';
  EXEWATCH_PLACEHOLDER_CUSTOMER = 'customer-id';
You take the key from the ExeWatch console. The app’s API Keys page already shows you the ready-made code with the key inside and a “Copy the key” button: copy and paste. A Windows key starts with ew_win_.
The customer
The customer is not a constant to edit. It tells you which of your customers the application is running for, so you read it from the license (or from the login, or from a setting). You have two ways to give it to ExeWatch.
If you already know it at startup, you pass it directly to StartExeWatch:
StartExeWatch('ACME-Corp'); // the value read from the customer's license
If you only know it later, for example after the login, you start ExeWatch without parameters and pass it when you have it, with SetExeWatchCustomer:
StartExeWatch;
// ... later, once the customer is known:
SetExeWatchCustomer('ACME-Corp');
The generated placeholder is customer-id, and I left it that way on purpose: a “basic” integration still logs, and you immediately notice what you have to change.
4. Link map file
This is a per-project option. When it is on, at the end of the build the symbol map is written inside the executable, in a PE section called .ewmap. There is no .map to ship next to the exe.
The alternative is still there: if you prefer to keep the .map next to the executable, it still works.
One thing for those who sign their executables with Authenticode: the map must be written before signing, because the added section invalidates a signature that is already in place.
5. Trigger an error and look at the stack trace
To try it I used PlainVcl, the VCL application from before, with a button that saves an order and a check that fails:
procedure TMainForm.CheckTotals(Total, Invoiced: Currency);
begin
  if Total <> Invoiced then
    raise Exception.Create('The order total does not match the invoice');
end;

procedure TMainForm.SaveOrder;
begin
  CheckTotals(100, 90);
end;

procedure TMainForm.SaveButtonClick(Sender: TObject);
begin
  SaveOrder;
end;
There is no call to ExeWatch in the handler: ExeWatch catches the unhandled exception of an OnClick by itself. StartExeWatch and FlushExeWatch in the .dpr, which the menu put there, are enough. I passed the customer ACME-Corp with SetExeWatchCustomer in the form’s FormCreate.
You compile, press the button and open the ExeWatch console. In the log detail you find the exception, the customer and the stack trace:
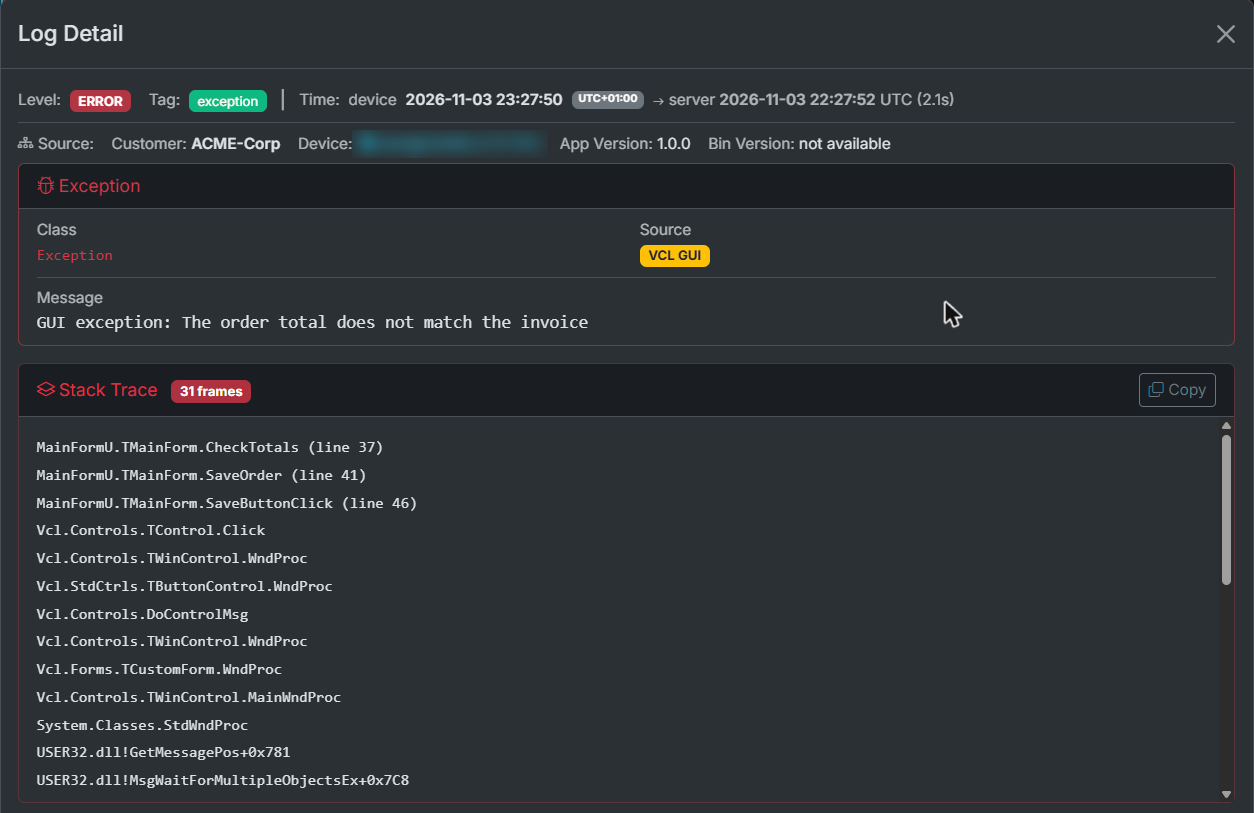
These are the first lines of the stack trace, on Win32:
MainFormU.TMainForm.CheckTotals (line 37)
MainFormU.TMainForm.SaveOrder (line 41)
MainFormU.TMainForm.SaveButtonClick (line 46)
Vcl.Controls.TControl.Click
Vcl.Controls.TWinControl.WndProc
Vcl.StdCtrls.TButtonControl.WndProc
Vcl.Controls.DoControlMsg
Vcl.Controls.TWinControl.WndProc
Vcl.Forms.TCustomForm.WndProc
Vcl.Controls.TWinControl.MainWndProc
System.Classes.StdWndProc
At the top is your code, with unit, function and line. Then comes the VCL, which carries the click to the handler. After that there are the system frames, which are names of functions exported by Windows, and more WndProc: 31 frames in all, and I show the first ones. Compiled for 64-bit, the same project gives the same path: CheckTotals, SaveOrder, SaveButtonClick, then Vcl.Controls.TControl.Click.
The console in the screenshot is a test instance of ExeWatch 1.90, with test data.
Think of all your applications! The step is always the same: open the project, Project > ExeWatch > Enable ExeWatch Telemetry, and the console receives everything you need to know how your applications are doing at your customers: errors with stack traces, logs, metrics, timing, real usage and installed versions. You see it with your own eyes, on a project you already have, and you can start for free with no time limit. Download the setup and try it. Plans are on exewatch.com/ui/pricing.
Stack traces, on Win32 and on Win64
The stack trace is one of the tools ExeWatch gives you, next to logs, metrics and timing. When an exception arrives from a customer it is one of the most useful, because it tells you where it was raised. What you get depends on the language.
Delphi, Win32 and Win64, Debug and Release. Every exception arrives with unit, function and line number, and the trace starts at the point where the exception was raised. It works on 32-bit too.
C++Builder. The menu is the same: Enable ExeWatch Telemetry adds ExeWatchConfig.pas and the SDK units to the project and inserts StartExeWatch(); and FlushExeWatch(); in the main .cpp. The project compiles the SDK units itself, so there is no DLL to ship and no import library to link. The stack trace has function names but no line numbers, because the C++ linker map does not contain them. An exception thrown with throw from C++ arrives with message, class, breadcrumbs, user and tags, but for now without a stack trace, and on Win64x the names are not resolved. I verified this part with RAD Studio 12 and 13.
The SDK DLL. It captures the exceptions raised in its own code and in a host that uses the same Delphi runtime. A host with a different runtime, such as MSVC or Python, does not get the stack trace of its own exceptions.
Not only stack traces: the health of your projects at the customer’s site
The stack trace tells you where an error blew up. To know how your applications are doing at your customers you need more, and ExeWatch collects it in the same place:
- the errors, with the stack trace, grouped by problem, version, customer and device, so you see who is affected and since when;
- the applications’ logs and metrics;
- the timing, nested too, to understand where the time goes;
- the real usage of the applications and the installed versions at each customer;
- an AI agent that reads the errors via MCP and from the command line, as I describe in ExeWatchMCP, KAI and your customers’ production.
To me it is the most complete solution for keeping an eye on the health of your projects at the customer’s site. If in production you already use a tool that captures exceptions and produces the stack trace, ExeWatch does not replace it: it gives you all the rest too, and it coexists with what you have (I wrote about it in ExeWatch and madExcept together). You can start with a free account.
From the command line: ExeWatchMapCLI
Outside the IDE (build scripts, CI, an AI agent) the map is linked with ExeWatchMapCLI.exe, right after the build, on the executable. The setup has already installed it in the bin folder and you can add it to the PATH:
ExeWatchMapCLI.exe MyApp.exe
ExeWatchMapCLI.exe MyApp.exe C:\build\MyApp.map --delete-map
The map ends up in the executable, as with the IDE menu. The Command line tab of the Playground also has a ready-made instruction text to hand to an AI agent, with the build settings, the command, how to read the result and what to do on each error.
The Playground
The third menu entry, Playground and updates…, opens a window with four tabs.
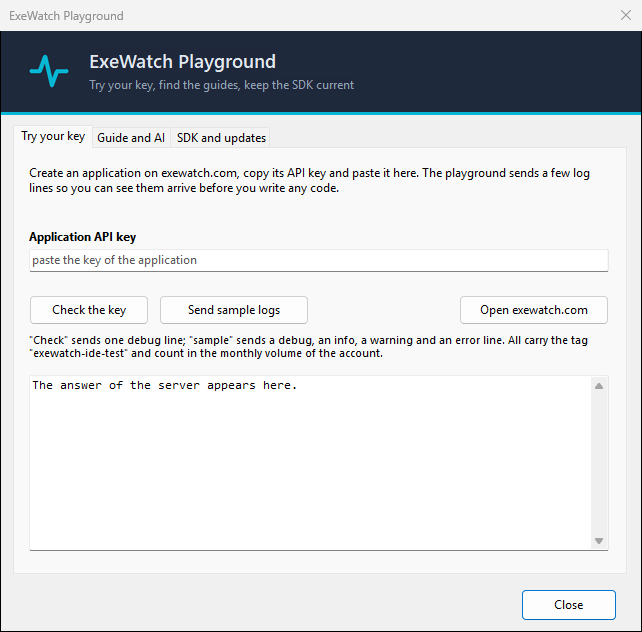
Try your key. You paste the application’s key and press “Check the key”, which sends one debug line, or “Send sample logs”, which sends four (debug, info, warning, error). You see the server’s response in the window. All of them carry the tag exewatch-ide-test and count toward the account’s monthly volume.
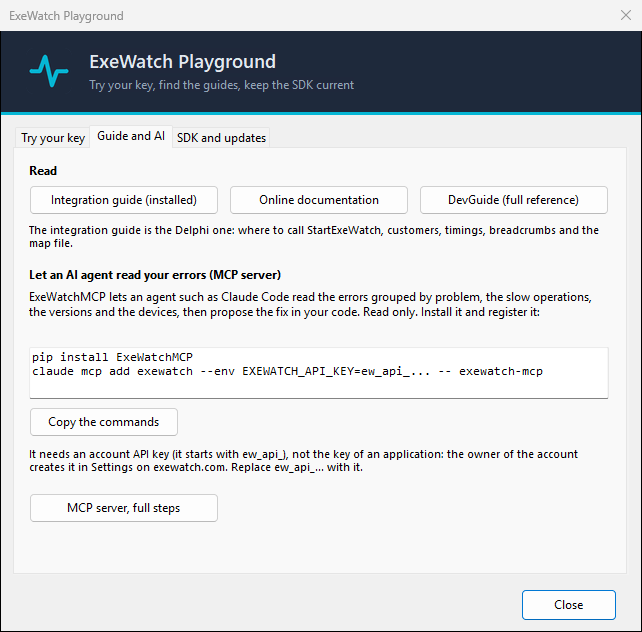
Guide and AI. Links to the guide and the commands to have an AI agent read the errors through the MCP server. If you do not know what I am talking about, I wrote about it in ExeWatchMCP, KAI and your customers’ production.
Command line. The one above.
SDK and updates. The installed version, the latest available, how urgent the update is and what changed.
From XE8 to 13
The support statement is XE8 and later. Here is what I actually tested and what I did not:
- I tested the IDE integration live in XE8 and in Delphi 13;
- the IDE layer compiles on XE8, 12 and 13;
- the native SDK compiles from XE8 to 13, Win32 and Win64, and cross-compiles to Linux64 with Delphi 13;
- as of this release the SDK test suite also runs on XE8, besides 12 and 13.
I have not tried the versions in between one by one, and I would rather tell you so.
Live: see you at ITDevCon 2026
ITDevCon 2026, Rome, November 19 and 20. This is where I show you ExeWatch for RAD Studio live, with the IDE integration: the setup, the menu, the stack trace arriving in the console. Bring a project of your own and any questions you have. Tickets here, the site is itdevcon.it.
The talks that include ExeWatch, both in the Sala Kirk:
- KAI + ExeWatch: il mondo Delphi non sarà più lo stesso (KAI + ExeWatch: the Delphi world will never be the same), from 10:35 to 11:30;
- ExeWatch: 500 persone stanno usando il tuo software in questo momento. Un crash report non ti dirà come sta andando. (ExeWatch: 500 people are using your software right now. A crash report will not tell you how it is going.), from 15:05 to 16:00.
The programme with all my talks is on my ITDevCon speaker page.
I am also taking it to EKON 30, the thirtieth-anniversary edition, Meliá Düsseldorf, November 23 to 27, 2026. Tickets here, and my speaker page.
Try it on a project of your own
How are your applications doing at your customers? Find out now, it’s free! Download the setup, open a project, pick Project > ExeWatch > Enable ExeWatch Telemetry and see what arrives in the console of your free account: errors, logs, metrics, timing and much more. The free plan has no expiry.
Download the setup, open a project you already have, and pick Project > ExeWatch > Enable ExeWatch Telemetry. Then log generously: the more ExeWatch sees, the more it helps when a customer calls. If you want to see what you can do with the data that arrives, I wrote about updates and the real usage of your applications and about nested timing. Everything else is on exewatch.com.
Frequently asked questions
What is ExeWatch for RAD Studio? It is the ExeWatch 1.90 setup that adds a menu to the Delphi and C++Builder IDE to turn on telemetry in a project and link the symbol map into the executable.
Which RAD Studio versions does it work with? From XE8 onward. The integration was tested live in the XE8 and Delphi 13 IDEs; the IDE layer compiles on XE8, 12 and 13.
Do I need administrator rights? No. The setup installs per user.
Does the stack trace work on Win32 and Win64? Yes, in Delphi: unit, function and line number, Debug and Release. What it does in C++Builder is explained in a separate section of the article.
Do I have to ship a .map file with the executable?
No, if the map is linked into the executable (“Link map file” option, PE section .ewmap). The .map next to the exe remains as an alternative.
Where do I put the customer?
It is not a constant: you read it from the customer’s license and pass it directly to StartExeWatch('ACME-Corp'), or later with SetExeWatchCustomer. The generated placeholder is customer-id.
Where can I see it live? Mainly at ITDevCon 2026 (Rome, November 19 and 20): Daniele Teti shows it live there. He is also taking it to EKON 30 (Düsseldorf, November 23 to 27).
Key facts
- ExeWatch 1.90.0 (Delphi SDK 0.25.0) is the first ExeWatch release that lives inside the RAD Studio IDE: the "ExeWatch for RAD Studio" setup (ExeWatchRADStudioSetup.exe, about 2.9 MB) adds an ExeWatch menu to Delphi and C++Builder. ExeWatch is the monitoring service by bit Time Professionals for Delphi, C++Builder, .NET, Python and JavaScript applications.
- One installer, per-user installation, no administrator rights. It integrates the expert into the IDE of every RAD Studio installed, from XE8 onward, and installs the SDK sources.
- Project > ExeWatch menu: "Enable ExeWatch Telemetry" adds ExeWatchConfig.pas and the SDK units to the project and inserts StartExeWatch and FlushExeWatch in the main file (.dpr for Delphi, .cpp for C++Builder). In the generated unit you change only the EXEWATCH_API_KEY constant, with the key taken from the ExeWatch console. The customer is not a constant: you read it from the customer's license and pass it to StartExeWatch('ACME') if it is already known at startup, or with SetExeWatchCustomer once you know it; the generated placeholder is 'customer-id'.
- Stack traces in Delphi, on Win32 and Win64, Debug and Release: unit, function and line number, with the symbol map linked into the executable (PE section .ewmap), so there is no .map file to ship. In C++Builder the stack trace has function names but no line numbers, because the C++ linker map does not contain them; an exception thrown with throw from C++ arrives with message, class, breadcrumbs, user and tags but without a stack trace for now. On Win64x the names are not resolved. The SDK DLL does not produce stack traces for hosts with a different runtime (MSVC, Python).
- Command line ExeWatchMapCLI.exe to link the map from build scripts, CI or an AI agent; the Playground contains a ready-made instruction text to hand to an agent.
- The Playground has four tabs: Try your key, Guide and AI, Command line, SDK and updates.
- The integration was tested live in the XE8 and Delphi 13 IDEs; the IDE layer compiles on XE8, 12 and 13. The C++Builder part is verified on RAD Studio 12 and 13.
- Daniele Teti shows it live at ITDevCon 2026 (Rome, November 19 and 20) and at EKON 30 (Düsseldorf, November 23 to 27, 2026).
- Author: Daniele Teti.
Comments