Integrating ExeWatch into Delphi Projects That Already Use madExcept
TL;DR: You don’t have to choose. If you already use madExcept, keep it. Drop the bridge unit into your project and every exception madExcept intercepts also lands in the ExeWatch dashboard — with madExcept’s symbolicated stack trace attached. No SDK upgrade, no changes to your existing madExcept configuration.
The Fear, Voiced by a Real Customer
A few days ago a customer of ours — a long-time Delphi developer, madExcept user since the early 2010s — asked this question:
“I’ve been using madExcept for years. The local dialog, the automatic email, the bug report zip — it’s all part of how my application reports problems. If I add ExeWatch, do I have to rip that out?”
The short answer is no. The longer answer is the subject of this article.
Someone might assume ExeWatch and madExcept are alternatives, but they are not. They solve overlapping problems from opposite ends, and when you put them together you get something better than either one alone. This post explains exactly why, and shows the integration in practice.
What Each Tool Does Well
Before talking about integration, it’s worth being precise about what each tool actually shines at. The confusion around “ExeWatch vs madExcept” often comes from assuming both are trying to do the same job — they aren’t.
madExcept: the last line of defence on the local machine
madExcept lives deep inside the process. When an exception fires, madExcept can:
- Resolve the stack trace with unit names and line numbers, using the debug info embedded at link time (so you don’t need to ship
.mapfiles alongside the exe) - Show a local dialog to the user, letting them add a comment before sending the report
- Save a full bug report to disk — complete with module list, register dump, thread list, screenshot — and keep it even when the network is offline
- Email the report or upload it to an FTP/HTTP endpoint automatically
- Detect frozen main threads and memory leaks
madExcept has been a reference tool in the Delphi ecosystem for over two decades, relied on by thousands of developers across just as many production desktop applications. It is solid, mature, and one of those libraries that does what it does so well, and has done so for so long, that it is hard to imagine building a desktop Delphi application without it. If your workflow depends on receiving crash reports via email, or on letting end users provide context through a dialog, madExcept is doing work that no cloud-first APM tool is designed to replace.
ExeWatch: what happens after the crash report is sent
ExeWatch starts where madExcept stops. Once an error has happened, the interesting questions are no longer “what was the stack?” but rather:
- Is this a new bug or a known one? Has it happened on other installations, on other versions of the app, in the last 24 hours?
- What was the user doing right before? Breadcrumbs — button clicks, navigations, HTTP requests — captured automatically by the SDK.
- How often is this firing in production? Across customers, across versions, across time.
- Is this affecting a single customer or many? ExeWatch shows you devices, customers, sessions.
- Are we seeing a trend? Health scores, alerts, anomaly detection.
- What was happening around it? Timing/profiling of slow operations, custom metrics, info logs leading up to the error.
ExeWatch aggregates logs, timings, metrics and health across all the installations of your application and gives you a dashboard to search and correlate them. It solves the “is my app actually doing fine out there?” question, not the “what just crashed on this user’s machine?” question.
And here is a point worth emphasising: an application that never crashes can still have unhappy customers. An operation the user perceives as slow but never flags, an import that fails with a generic error message, an HTTP call that only times out on networks in a certain country, an error trend that quietly creeps up over weeks, a checkout flow that slows down when the database is under load — none of this ever shows up in a crash report, and no “crash-only” integration will ever see it, yet these are exactly the things that erode the perceived quality of your software day after day. ExeWatch is designed for these scenarios at least as much as for crashes.
In this framing, madExcept provides one highly detailed piece of the puzzle — the piece when there is a crash. ExeWatch takes that piece and sets it inside a much larger picture that also includes timing, metrics, trends, breadcrumbs and health. An application can easily be “stable” — zero crashes in six months — and at the same time leave users frustrated by slowdowns, silent errors or performance regressions that no exception handler will ever see.
Why the Two Can Feel Like They’re Fighting
When users first add ExeWatch to an app that already has madExcept, they typically notice something odd: uncaught exceptions never reach the ExeWatch dashboard, even though other logs do.
The cause is a question of ordering. ExeWatch’s auto-capture of GUI exceptions hooks into the VCL’s Application.OnException. madExcept’s own hook is installed at a lower level — essentially between the OS and the RTL — and fires before the VCL handler runs. Once madExcept has handled the exception (whether by showing a dialog, sending an email, or restarting the application), the VCL handler never runs. As a result, ExeWatch’s hook never sees the exception.
This isn’t a bug in either tool. It’s how madExcept is designed to work, and the same thing happens if you chain it with any other library that also wants to see uncaught exceptions (Sentry, EurekaLog, custom logging frameworks). Whoever hooks first wins.
The answer is not to remove one of the hooks — both serve real purposes. The answer is to let madExcept catch the exception first, then have it explicitly pass a copy to ExeWatch from inside its own callback. This is a documented extension point in madExcept called RegisterExceptionHandler.
The Bridge: One Unit of Code
Here is the entire bridge. Drop this file into your project, list it in the uses clause of the .dpr, and you are done — the initialization section installs the callback automatically:
unit ExeWatchMadExceptBridgeU;

interface

implementation

uses
  System.SysUtils,
  System.JSON,
  madExcept,
  ExeWatchSDKv1;

procedure ExeWatchMadExceptHandler(const ExceptIntf: IMEException;
  var Handled: Boolean);
var
  ExtraData: TJSONObject;
  ExClass, ExMsg: string;
  E: TObject;
begin
  if (ExceptIntf = nil) or (not ExeWatchIsInitialized) then
    Exit;

  E := ExceptIntf.ExceptObject;
  if Assigned(E) and (E is Exception) then
  begin
    ExClass := E.ClassName;
    ExMsg   := Exception(E).Message;
  end
  else
  begin
    ExClass := ExceptIntf.ExceptClass;
    ExMsg   := ExceptIntf.ExceptMessage;
  end;

  ExtraData := TJSONObject.Create;
  ExtraData.AddPair('exception_class',   ExClass);
  ExtraData.AddPair('exception_message', ExMsg);
  ExtraData.AddPair('stack_trace',       ExceptIntf.BugReport);

  EW.Log(llError, ExMsg, 'exception', ExtraData);

  // Handled is deliberately left untouched: madExcept's dialog, bug report
  // and email flow continue to run exactly as before.
end;

initialization
  RegisterExceptionHandler(ExeWatchMadExceptHandler, stDontSync);

finalization
  UnregisterExceptionHandler(ExeWatchMadExceptHandler);

end.
That’s the whole thing. Three observations worth making:
1. The callback does not consume the exception. Handled is left untouched, so madExcept’s normal pipeline — the dialog, the email, the bug report save — keeps running exactly as it did before the bridge existed. End users see the same experience.
2. stDontSync lets the callback run on any thread. ExeWatch’s logging API is thread-safe, so we don’t need madExcept to marshal the call to the main thread. This matters in services or worker-thread-heavy apps where a forced sync could stall.
3. The stack trace sent to ExeWatch is madExcept’s, not the SDK’s. This is the part most people miss. ExceptIntf.BugReport contains the fully symbolicated stack — unit names, line numbers, module list, registers — resolved using the debug info madExcept embedded at link time. We pass that string to ExeWatch via the extra_data.stack_trace field. ExeWatch’s own log method honours a caller-supplied stack_trace and does not replace it, so the dashboard shows madExcept’s resolved frames instead of raw addresses.
What You Actually Get
After installing the bridge, the exception path looks like this:
- An exception fires somewhere in your code
- madExcept intercepts it — exactly as it did before
- Our callback runs while madExcept is still processing
- We ship an ERROR-level log to ExeWatch with madExcept’s stack attached
- madExcept’s own flow continues unchanged: dialog, bug report, email to the dev team, optional restart
The net result is that for every exception you now have both:
- On the local machine: whatever madExcept has always done — the dialog, the report file, the email
- In the ExeWatch cloud dashboard: the same exception, with madExcept’s symbolicated stack, alongside the breadcrumbs, session ID, device info, customer ID, app version, and any other logs the SDK captured around it
Visually, the contrast is this.
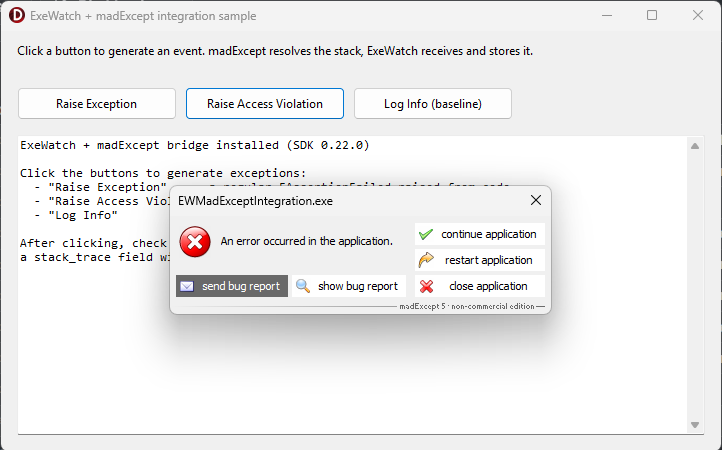
On the end user's PC: madExcept is doing its usual job — local error dialog with the familiar send bug report, continue application, restart, close buttons. The end user's experience hasn't changed at all.
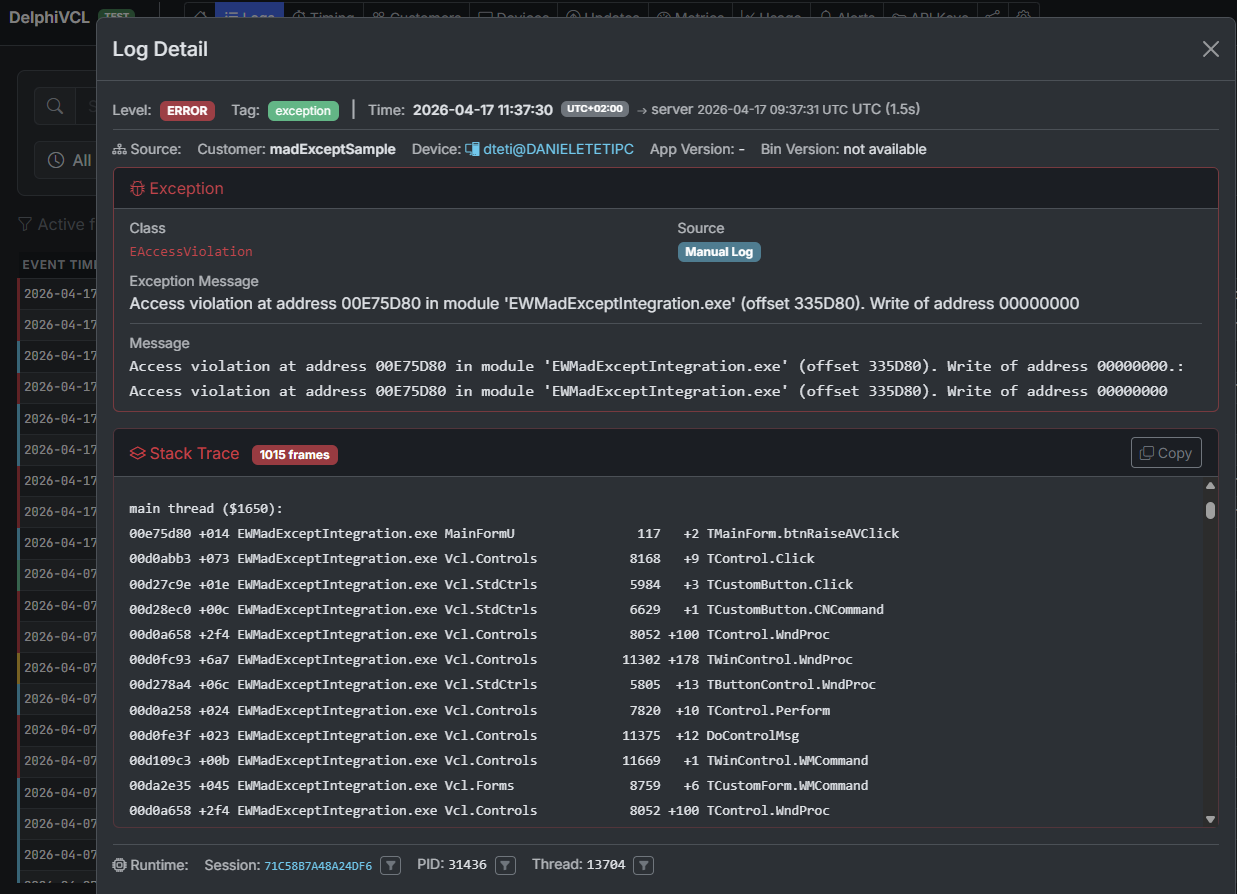
On the developer's screen, in the ExeWatch dashboard: the same exception — here an EAccessViolation — arrives aggregated, with madExcept's fully resolved stack trace (unit names, line numbers, module offsets) and all the context the SDK captured around it (session, thread, device, breadcrumbs, timing).
The value of the second isn’t a duplicate of the first. madExcept tells you one crash. ExeWatch tells you:
- Is this happening only on v2.3.1?
- Are Windows 10 users hitting it more than Windows 11?
- Did it start after the last deploy?
- Which customer hit it first?
- What did the user click just before?
- Are the affected devices all running a specific antivirus?
These are correlation and trend questions that call for a different level of aggregation — exactly the level ExeWatch provides. It’s not a limitation of madExcept: these are different planes of the same problem, and madExcept keeps doing its job beautifully on its own plane.
A Concrete Example
Consider an application that has been using madExcept for years, with its well-established email-report workflow. Each exception generates a dialog, the user clicks “Send”, the dev team receives a rich, detailed zip file — excellent for understanding any single case. As the install base grows, a second, complementary layer of reading also becomes useful: grouping by version, counts per customer, trends over time.
Add ExeWatch alongside. Install the bridge. Deploy.
From the next day:
- The email flow is unchanged — the dev team keeps receiving bug reports exactly as before.
- The ExeWatch dashboard now shows every exception, grouped by fingerprint (exception class + stack), with counts per version and per customer.
- An alert is configured: “if errors exceed 3 in 10 minutes, send to Discord”. The first real regression after a deploy is caught in minutes, before users start phoning in.
- An anomaly detection rule spots a gradual increase in a specific exception over the last week — a slow memory leak manifesting only after a few hours of use — surfaced by the temporal aggregation across the installation base.
madExcept is still doing its job. ExeWatch is doing a different job. Neither replaces the other.
Prerequisites and Where to Find the Code
The full sample, with a demo form that intentionally raises regular exceptions, access violations, and baseline info logs, lives in the ExeWatch samples repository:
github.com/danieleteti/ExeWatchSamples › SpecificScenarios/madExceptIntegration
The sample bundles:
ExeWatchMadExceptBridgeU.pas— the single file you drop into your own projectEWMadExceptIntegration.dproj— a runnable Delphi 12+ demo project (Win32 + Win64)MainFormU.pas/.dfm— three buttons to trigger a regular Exception, an access violation, and a plain info log for comparisonEWMadExceptIntegration.mes— the madExcept settings file so that opening the project links madExcept automaticallyREADME.md— step-by-step instructions plus variations (sending only the call stack instead of the full bug report, filtering non-crash exceptions, EurekaLog equivalent)
Requirements:
- madExcept installed in the IDE — available at madshi.net
- Delphi XE8 or newer — the bridge uses only standard RTL features (System.JSON, scoped unit names, try/except with typed Exception)
- ExeWatch SDK v0.21.0 or newer — any recent version works; no special build required
- An ExeWatch account — the Hobby plan is free, no credit card
The same pattern extends to EurekaLog via its RegisterEventExceptionNotify callback. The logic is identical: extract the resolved stack from EurekaLog’s exception info, build the same extra_data payload, call EW.Log. We’ll add a dedicated EurekaLog sample to the repository in the coming weeks.
The full integration section, with a direct link anchor you can share, is also documented at exewatch.com/ui/docs#coexisting-madexcept.
What If You Don’t Use madExcept?
A natural follow-up question after all this: can I get an accurate stack trace without madExcept?
Yes. The ExeWatch Delphi SDK captures stack traces natively at every EW.Error, EW.Fatal and EW.ErrorWithException call. The only operational constraint, for now, is that to see readable unit names and line numbers instead of raw memory addresses you need to ship the .map file alongside the executable — generated by setting “Detailed” as the Map file in the project’s Linking options. It’s one extra step at release time, but it solves the problem.
madExcept moves that step to link time, embedding the debug information inside the executable itself, which is why we rely on its already-resolved stack when it’s in the picture. We’re evaluating ways to remove the .map dependency even without madExcept — for questions, feedback or requests, write to exewatch@bittime.it.
Don’t Choose — Integrate
If you’re evaluating ExeWatch and you’re worried it means walking away from a tool you’ve relied on for years, don’t be. madExcept and ExeWatch aren’t duplicates; they’re layers of the same observability story. The local layer — dialogs, reports, dumps — is what madExcept does best. The cloud layer — aggregation, search, alerts, trends — is what ExeWatch does best.
One short bridge unit is all it takes to make them work together, and when they do, you get a view of your application’s health that neither tool alone can offer.
Links and Resources
- ExeWatch: exewatch.com
- madExcept integration sample: github.com/danieleteti/ExeWatchSamples › SpecificScenarios/madExceptIntegration
- Documentation — Coexisting with madExcept / EurekaLog: exewatch.com/ui/docs#coexisting-madexcept
- madExcept: madshi.net
- Previous article: ExeWatch 1.8: .NET SDK, Custom Metrics, Health Monitoring and On Premise
ExeWatch — Monitoring for server, desktop and web applications. Built by bit Time Professionals.
Comments
comments powered by Disqus