ExeWatch 1.6: Updates Tracking and Usage Analytics — Do You Really Know How Your Software Is Used?
TL;DR: ExeWatch 1.6 adds two features that many developers were asking for: updates tracking (who installed which version, when) and Usage Analytics (sessions, active devices, usage heatmap, OS distribution, error rate by version). All without writing a single extra line of code. Try it at exewatch.com
An Enthusiastic Response from the Delphi Community
Before diving into the new features, I want to share something that we’re very pleased about. The ExeWatch launch generated interest that went well beyond our expectations. On launch day and in the following week, we saw a wave of sign-ups from the Delphi community that confirmed something: the need for professional monitoring tools in the desktop world was real and deeply felt.
Many developers wrote to us saying they had been looking for something like this for years. Not a generic tool designed for the web and adapted for desktop, but something native, that understood the specific needs of those developing VCL, FireMonkey, service, and console applications. This feedback pushed us to accelerate on two features that were at the top of the request list: version tracking and usage analytics.
The Problem: “Who Is Running What?”
If you develop software for enterprise customers, you know this situation well. You release version 2.5, but two weeks later you discover that half your customers are still on 2.3. Some even on 2.1. And when a bug report comes in, the first question is always: “What version do you have installed?”
Until now, getting this kind of information required a dedicated license management system, or — and I say this without judgment because we’ve all been there — a manually updated Excel spreadsheet.
With ExeWatch 1.6, this information arrives automatically, with zero additional effort.
Updates Tracking: Complete Version History
Every time a device launches the application with a different version than before, ExeWatch automatically records the event. No code changes needed: if the SDK is already integrated, tracking works immediately.
In the new Updates page for each application, you’ll immediately find four key indicators: Total Devices (how many devices in total), Versions in Use (how many different versions are in circulation), Latest Version (the most recent release detected), and Adoption (the percentage of devices already updated to the latest version). A single glance is enough to understand the state of your releases.
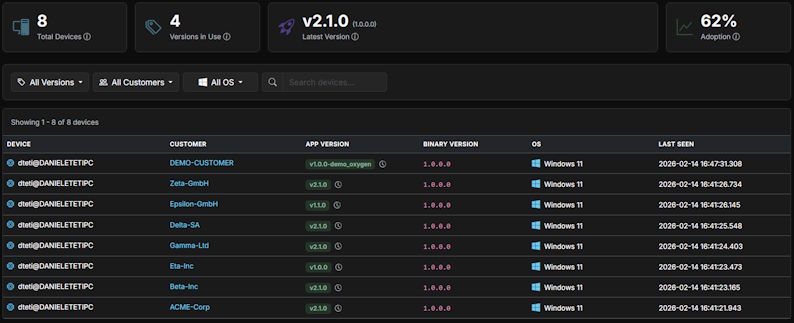
Below the stats cards, the page offers:
- Details of each update: fresh install, upgrade, or downgrade
- Complete history for each individual device, with a visual timeline
- Automatic OS change detection — if a user upgrades from Windows 10 to Windows 11, you’ll see it
- Filters by version, customer, and operating system
In practice, you open the Updates page and immediately know exactly how many customers have the latest version, how many still need to update, and if anyone has downgraded (often a signal of problems with the new release).
Usage Analytics: Understanding How Your Software Is Used
This is the feature that personally excites me the most. As developers, we’re obsessed with code, performance, and bugs. But we often neglect a fundamental question: “How is our software actually being used?”
The new Usage page answers this question with concrete data:
Active Sessions, Devices, and Customers
Three base metrics with trend comparison against the previous period. You immediately see whether adoption is growing, stable, or declining. The percentage delta gives you the pulse of the situation at a glance.
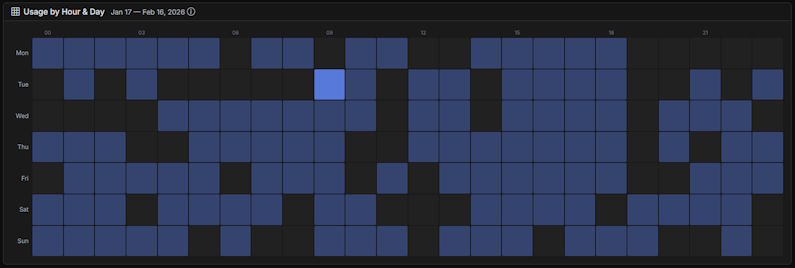
Usage Heatmap
An hour × day-of-week matrix showing when your application is used the most. It’s surprising how much useful information emerges from this visualization: discover that your users work mainly on Tuesday and Thursday mornings? Maybe it’s best to avoid releasing updates during those time slots.
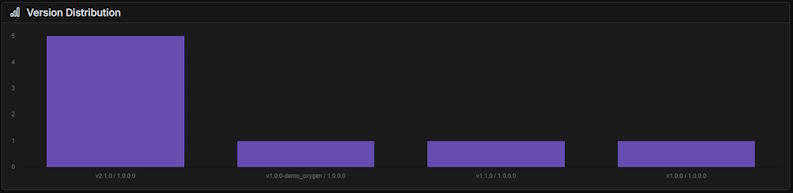
Version and OS Distribution
Two pie charts showing the distribution of versions in use and operating systems across your devices. Useful for seeing at a glance how many users have adopted the latest version and which platforms to actively support.
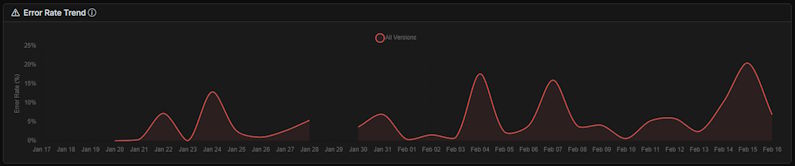
Error Rate by Version
Perhaps the most important chart: it shows the error rate for each version of the application. If version 2.5 has an error rate of 3% while 2.4 was at 0.8%, you have a clear signal that something went wrong in the last release.
Top Customers
A ranking of the most active customers by session count. Useful for understanding who your power users are and, most importantly, for catching who has stopped using the product — a customer dropping from 50 weekly sessions to 5 is a warning sign you shouldn’t ignore.
Zero Additional Code
I want to emphasize an important point: all these metrics are calculated automatically from the data the SDK already collects. If you’ve integrated ExeWatch into your application, Usage Analytics work right away. You don’t need to add calls, you don’t need to track custom events, you don’t need to modify anything.
The SDK automatically records the start of each session with a unique ID. From that single piece of data, ExeWatch derives sessions, active devices, active customers, usage patterns, and everything else.
Time Range Selector
All analytics support three time windows: 7 days, 30 days, and 90 days (depending on your plan). This allows you to analyze both recent trends and medium-term ones.
Try It
Usage Analytics and Updates Tracking are available on all plans, including the free Hobby plan (with a 7-day window). If you’re already using ExeWatch, the new pages are already available in your application’s toolbar. If you’re not using it yet, this is a great time to start.
Integration takes 5 minutes and the free plan is enough to evaluate whether the tool is right for you.
Links and Resources
- Official website: exewatch.com
- Full changelog: exewatch.com/ui/changelog
- Previous article: ExeWatch: Proactive Software Monitoring
- ITDevCon: itdevcon.it - The European Delphi conference
ExeWatch — Do you really know how your software is used? Now you do. Created by bit Time Professionals.
Comments
comments powered by Disqus