Steal This Code: ExeWatch Monitoring for Delphi, .NET, C++ & More
🇮🇹 Italiano • 🇩🇪 Deutsch • 🇪🇸 Español • 🇧🇷 Português
ExeWatch: real-time application monitoring for Delphi, C++Builder, .NET, JavaScript and Python, with a built-in AI engine and a free Hobby plan.
TL;DR: The ExeWatch Samples repository is a set of runnable projects that show how to wire ExeWatch into real applications: Delphi (VCL, FMX, Android, WebBroker, DMVCFramework, runtime packages, webhooks), .NET (Console, Windows Forms, Windows Service), JavaScript in the browser, and C++Builder / MSVC / Python through the native DLL. Each sample exercises a slice of the SDK, so you copy the pattern that matches your app. One API key, free Hobby plan, and your events show up in the dashboard within seconds.
ExeWatch is growing, and the community is building on it
ExeWatch keeps growing, fast. In just a few months it has reached hundreds of registered developers who are now monitoring production software written in Delphi, C++Builder, .NET, JavaScript and Python, from desktop apps and Windows services to REST APIs and full web applications.
What they reach for first tells you a lot about why people stay:
- Automatic exception capture - unhandled errors are caught and reported, with class, message and stack.
- Breadcrumb trails - the exact sequence of actions that led to an error, attached automatically to the failure.
- Performance timings with Avg / Min / Max / P95 - measure any operation and watch the trend in the dashboard.
- Nested timing traces - profiler-style waterfalls and an aggregated Calling-Context-Tree, to see where the time actually goes.
- Counters and gauges - business and runtime metrics next to your logs.
- Hardware and device intelligence - CPU, RAM, disk, OS, monitors, mobile device details.
- Multi-customer tracking - filter every log by customer id.
- Email and timing alerts plus webhooks - get notified, or drive your own automation, when something goes wrong or gets slow.
- A built-in AI engine that helps make sense of all of it.
One feature deserves a special mention: Nested Timing Traces, one of the most requested additions and the one we get the most positive feedback on. It turns a flat list of timings into a profiler-style waterfall that shows exactly where the time goes, with merged loops and per-node avg/min/max/p95. Every SDK in the repository ships a ready-to-run nested-trace demo (GenerateInvoiceReport), so you can produce a tree like this from your own app in minutes:
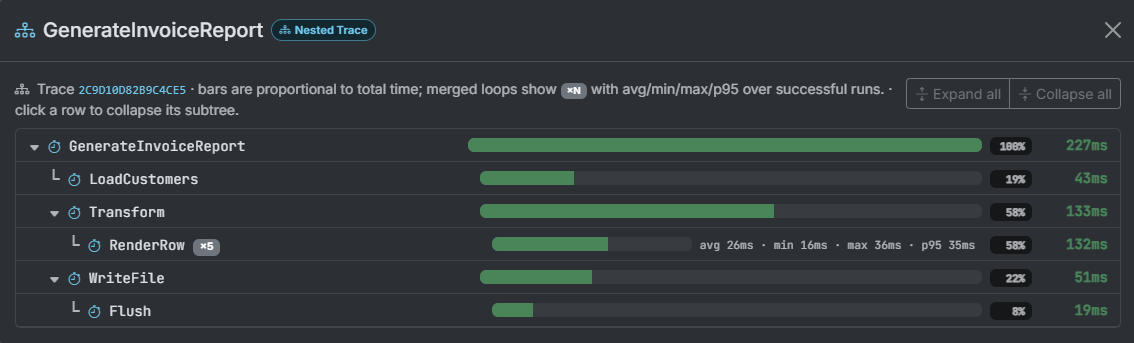
If you want the full story on how traces are built and visualized, see the dedicated article: ExeWatch 1.35: Nested Timing Traces.
The fastest way to understand what that looks like in your own code is the samples repository. Let me walk through it.
Why these samples matter: real versions, real languages
This repository is not just a marketing showcase. It exists because the questions are real. In the last few weeks alone, one customer asked me to add ExeWatch to a Delphi 6 application, another to a C++Builder 10 project, and another wanted to drive it from a language that is not on the usual list at all.
Every one of those requests has an answer in here, and that is exactly the point: the samples are the fastest way to see which SDK to use for which environment, and how.
- Modern Delphi (XE8 and newer) uses the native Pascal SDK (
ExeWatchSDKv1.pas+ the VCL or FMX hook): the VCL, FMX, Android, WebBroker and DMVCFramework samples all follow this path. - Legacy Delphi (down to Delphi 6/7) and any pre-XE8 version cannot compile the modern unit, so they talk to the native DLL through the Pascal import unit
ExeWatchSDKv1Imports.pasinDLLSDKCommons/. Same calls, same dashboard, just bound to the DLL instead of compiled in. - C++Builder (old and new) loads the same DLL dynamically: the
CPPBuilderWithDLLSDK/sample compiles unchanged under bcc32, bcc64 and bcc64x, so a C++Builder 10 project and a 13 project use identical code. - Other languages consume the DLL through its plain Windows ABI: the MSVC and Python ctypes samples prove the pattern, which then ports to Rust, Go, MinGW, Clang and beyond.
So when someone asks “can I put ExeWatch on this old compiler / that unusual language?”, the honest answer is usually “yes, and here is the sample that shows you how”.
Before you start: one API key, no credit card
Every sample needs a valid API key. Sign up at exewatch.com, create an application in the dashboard, and copy its key (the prefix depends on the target platform: ew_win_ Windows, ew_lin_ Linux, ew_mac_ macOS, ew_and_ Android, ew_ios_ iOS, ew_web_ browser). The free Hobby plan asks for no credit card and gives you one application, 10,000 events per month, 7-day retention and two alerts: more than enough to run everything here.
Then it is always the same loop: open the project, paste your key where the placeholder is, build, run, and watch the events land in the dashboard in real time.
Desktop and mobile clients
These are the “client on someone else’s machine” samples: GUI apps where exception capture and breadcrumbs matter most, because you usually cannot reproduce the crash locally.
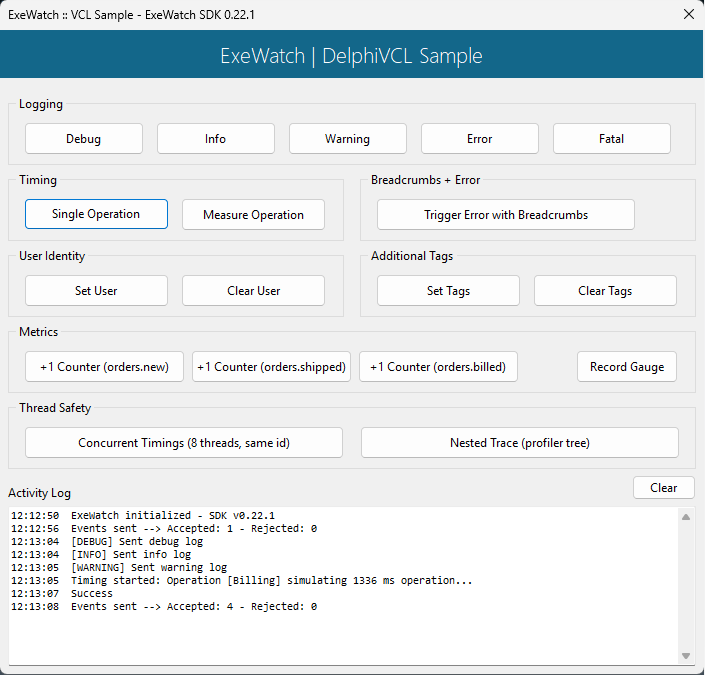
Delphi VCL (DelphiVCL/) is the canonical starting point. A Windows desktop form with one button per feature: the five log levels, timing, breadcrumbs-then-error, user identity, tags, counters and gauges, plus automatic VCL exception capture via ExeWatchSDKv1.VCL. Logs are persisted to disk before shipping, so nothing is lost if the app crashes. Reach for it when you build classic Windows desktop software in Delphi and want the shortest path from zero to data.
uses ExeWatchSDKv1, ExeWatchSDKv1.VCL;   // VCL hook = automatic GUI exception capture

InitializeExeWatch(EXEWATCH_API_KEY, 'SampleCustomer');
EW.Info('User logged in', 'auth');
Delphi FMX (DelphiFMX/) mirrors the VCL sample feature for feature, but on FireMonkey, so it can target Windows, macOS, Linux, iOS and Android. The only real difference is the uses clause: ExeWatchSDKv1.FMX instead of the VCL hook. Reach for it when you ship a cross-platform FireMonkey app.
uses ExeWatchSDKv1, ExeWatchSDKv1.FMX;   // FMX hook instead of the VCL one

InitializeExeWatch(EXEWATCH_API_KEY, 'SampleCustomer');
EW.Info('User logged in', 'auth');
Delphi Android (DelphiAndroid/) is the FMX SDK aimed squarely at a phone. A narrow scrollable UI built in code exercises every entry point, including background-thread usage and flush, and it leans into mobile-specific concerns: Android-flavoured device info, capturing an unhandled exception before the process is torn down, and proving thread-safety off the UI thread. Reach for it when you target Android and want to tap through the whole API on a real device or emulator.
uses ExeWatchSDKv1, ExeWatchSDKv1.FMX;

InitializeExeWatch(EXEWATCH_API_KEY, 'AndroidSample');   // Android key: ew_and_
EW.Info('Info message from Android', 'test');
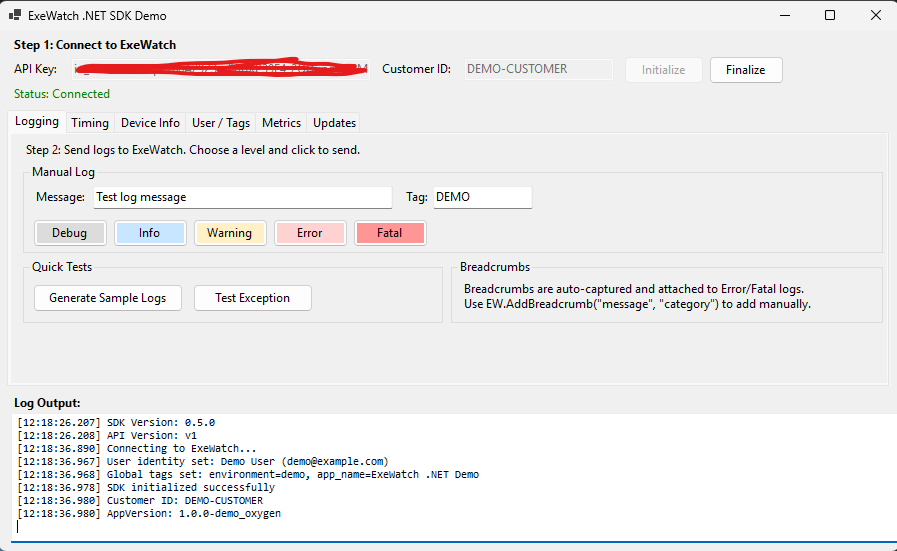
.NET Windows Forms (DotNetWindowsForms/) is the C# counterpart: a tabbed GUI where you paste the API key at runtime (no recompiling) and explore logging, nested and parallel timings, device info, metrics and simulated version upgrades. It installs ExeWatch.WinForms to capture Application.ThreadException automatically. Reach for it when your desktop app is WinForms.
ExeWatchWinForms.Install();   // capture Application.ThreadException, before Application.Run()

ExeWatchSdk.Initialize(new ExeWatchConfig(apiKey, customerId));
EW.Info("User logged in", "auth");
Servers, services and web apps
Long-running, headless or server-side code, where timings, counters and structured error context turn into operational visibility.
Delphi WebBroker (DelphiWebBroker/) is a small REST server that wraps every request in a single HandleRequest helper: increment a request counter, drop a breadcrumb, start a timing, run the handler, then record success or failure (and on error, count it, log the exception and return HTTP 500). Six demo endpoints, including a ?ms= delay to generate slow responses. Reach for it when you have a WebBroker service and want request-level monitoring with one wrapper.
InitializeExeWatch(TExeWatchConfig.Create(EXEWATCH_API_KEY, 'demo_customer'));
EW.SetTag('app', 'WebBrokerSample');

// inside the per-request wrapper:
EW.IncrementCounter('http.requests', 1);
EW.StartTiming(Endpoint);
try
  Handler;
  EW.EndTiming(Endpoint, nil, True);    // success
except
  on E: Exception do
    EW.EndTiming(Endpoint, nil, False); // failure
end;
Delphi DMVCFramework (DelphiDMVCFramework/) is the most complete server-side sample: a full web app with TemplatePro and HTMX, People CRUD with live search and batch import, heavy reports with nested timings, simulated external services with realistic failure modes (payment timeouts, 429 rate limits, 502s), structured extra data, breadcrumbs, counters and periodic gauges. The headline is how little it takes: three lines in the .dpr and no controller changes. You route DMVCFramework’s LoggerPro output to ExeWatch with a callback appender, call InitializeExeWatch, and point the framework’s built-in action Profiler at the logger. From there every request is logged and timed for free. Reach for it when you build APIs or web apps with DMVCFramework and want deep visibility for almost no code.
// 1. route DMVCFramework's LoggerPro output to ExeWatch
SetDefaultLogger(CreateLogBuilderWithDefaultConfiguration.WriteToCallback
  .WithCallback(procedure(const ALogItem: TLogItem; const AFormattedMessage: string)
  begin
    if ExeWatchIsInitialized and (ALogItem.LogType > TLogType.Debug) then
      EW.Log(TEWLogLevel(Ord(ALogItem.LogType)), ALogItem.LogMessage,
        ALogItem.LogTag, ALogItem.TimeStamp, ALogItem.ThreadID);
  end).Done.Build);

// 2. initialize, then 3. point the built-in profiler at the logger
InitializeExeWatch(TExeWatchConfig.Create(EXEWATCH_API_KEY, 'dmvc_sample_customer'));
Profiler.ProfileLogger := Log;        // every action timed, no controller changes
Profiler.WarningThreshold := 500;     // warn if an action takes > 500 ms
Delphi WebHook receiver (DelphiWebHookSample/) flips the relationship: instead of sending data to ExeWatch, it receives ExeWatch alert webhooks. A DMVCFramework controller validates the webhook token and processes the alert payload, and a companion trace-demo endpoint emits a nested timing trace on demand. Reach for it when you want alerts to trigger your own automation (chat notifications, ticketing, auto-remediation) instead of just email.
// validate the shared secret, then act on the alert payload
if Context.Request.Headers['X-ExeWatch-Token'] <> EXEWATCH_WEBHOOK_TOKEN then
  Exit(UnauthorizedResponse('Invalid token'));

AlertType := Payload.S['alert_type'];   // 'log_level', 'timing', 'health_critical'...
LogI('ExeWatch [%s] %s: %s', [AlertType, Payload.S['app_name'], Payload.S['message']]);
Result := OKResponse('Webhook received');
.NET Windows Service (DotNetWindowsService/) is a Worker Service with a 10-second processing cycle. It shows the recommended long-running-service pattern: initialize in StartAsync, wrap each cycle in an outer timing with nested sub-timings, use the try/catch timing convention so failed cycles are marked failed without crashing the service, emit counters and gauges, and flush on StopAsync. It can run as a console app or be installed with sc create. Reach for it when you operate background services or daemons.
// StartAsync - once at service startup
ExeWatchSdk.Initialize(new ExeWatchConfig(ApiKey, CustomerId) { AppVersion = "1.0.0-service-demo" });
EW.SetTag("service_name", "ExeWatchDemoService");
EW.Info("Service started", "lifecycle");

// each cycle - timed, failures marked without crashing the service
EW.StartTiming("process_cycle", "worker");
try { /* ... do work ... */ EW.EndTiming("process_cycle"); }
catch (Exception ex) {
    EW.EndTiming("process_cycle", new Dictionary<string, object> { ["error"] = ex.Message }, false);
}
.NET Console (DotNetConsole/) runs through the whole SDK surface sequentially, including 20 timed iterations with random failures so the dashboard immediately shows a realistic Avg / Min / Max / P95 and success rate. Reach for it when you want a 60-second smoke test of the .NET SDK, or a CLI/batch job to instrument.
var config = new ExeWatchConfig(ApiKey, CustomerId) { AppVersion = "1.0.0-console-demo" };
ExeWatchSdk.Initialize(config);
EW.SetTag("environment", "development");
EW.Info("Configuration loaded successfully", "config");
In the browser
JavaScript (JS/) is a single index.html: no npm, no build step. Set window.ewConfig with your ew_web_ key, load the SDK from the CDN, and click buttons for logging, timing, breadcrumbs-then-error, user identity, tags and metrics. Reach for it when you want front-end error and performance tracking on a plain web page or inside an existing site.
<script>
  window.ewConfig = { apiKey: 'ew_web_...', customerId: 'SampleCustomer', appVersion: '1.0.0' };
</script>
<script src="https://exewatch.com/static/js/exewatch.v1.min.js"></script>
<script>
  ew.info('User signed in', 'auth');   // global 'ew' is ready once the SDK loads
</script>
C, C++ and any language that can call a DLL
ExeWatch ships a native DLL that exports a deliberately boring Windows ABI: extern "C" + __stdcall + wchar_t* + #pragma pack(1). That makes it consumable from almost anything. All these samples load it dynamically with LoadLibrary + GetProcAddress, which sidesteps the classic .lib vs .a import-library mismatch and lets the app start cleanly even when the DLL is missing.
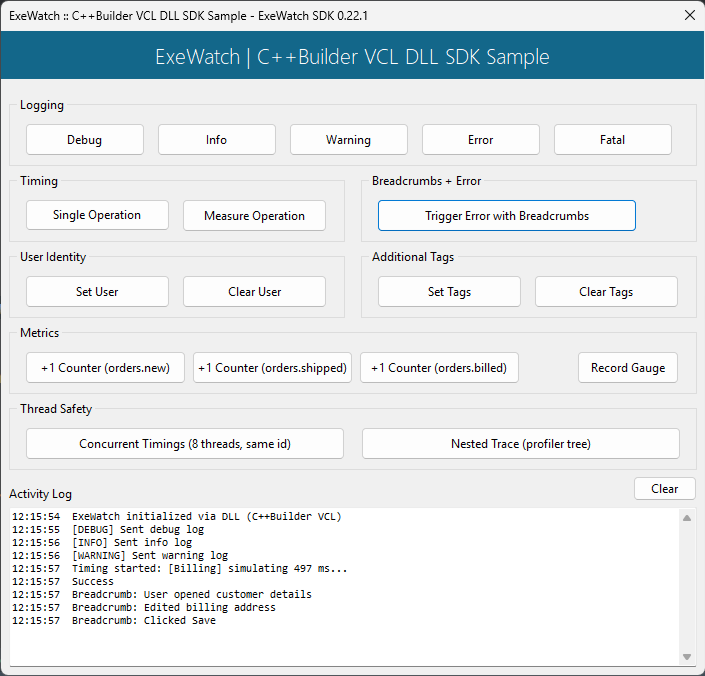
C++Builder (CPPBuilderWithDLLSDK/) is a VCL app that drives the DLL through the shared ExeWatchSDKv1.h + ExeWatchSDKv1.dynload.c pair. One #define EW_DYNAMIC_LOAD turns every ew_* into a function pointer, and the same source compiles under bcc32, bcc64 and bcc64x. Reach for it when you work in C++Builder and want to avoid linker fights.
#define EW_DYNAMIC_LOAD          // every ew_* becomes a function pointer
#include "ExeWatchSDKv1.h"

if (ew_LoadSDK() != EW_OK) { /* DLL missing: show a friendly message */ }
ew_Initialize(EXEWATCH_API_KEY, L"Sample C++ Customer", L"");
ew_Info(L"This is an INFO message", L"sample");
Microsoft Visual C++ (MSVCWithDLLSDK/) proves the DLL SDK has no limits and no dependencies, and can be used anywhere by anyone, with nothing from the Embarcadero ecosystem in sight: a pure cl.exe console app, with a run_msvc.cmd that locates vcvars64.bat, compiles and runs. It walks the common surface (init, user, tags, breadcrumbs, timing, counter, gauge, error with auto-attached breadcrumbs, flush, shutdown). Reach for it when your codebase is MSVC, or you just want a self-contained quickstart.
#define EW_DYNAMIC_LOAD
#include "ExeWatchSDKv1.h"

ew_LoadSDK();
ew_Initialize(EXEWATCH_API_KEY, CUSTOMER_ID, APP_VERSION);
ew_SetTag(L"environment", L"dev");
ew_Info(L"Sample app started", L"startup");
The DLL from other languages (SpecificScenarios/DllFromOtherLanguages/) is the proof-of-portability corner. A pure Python ctypes smoke test validates all five ABI axes (calling convention, undecorated names, UTF-16 marshalling, struct packing and the callback ABI) with no Embarcadero footprint at all. The README is explicit that for a real Python app you should use the native Python SDK module, which you download from the dashboard’s Integration page exactly the way you download the Delphi units (it is not on PyPI yet, so there is no pip install); this sample exists as a porting reference for Rust, Go, MinGW, Clang and other FFI-capable runtimes. Reach for it when you need to call ExeWatch from an unusual toolchain and want a template you can trust.
dll = ctypes.WinDLL(dll_path)                 # stdcall ABI, undecorated names
cfg = TEWDLLConfig(); cfg.StructSize = sizeof(TEWDLLConfig)
cfg.ApiKey = EXEWATCH_API_KEY; cfg.CustomerId = CUSTOMER_ID; cfg.SampleRate = 1.0
dll.ew_InitializeEx(byref(cfg))
dll.ew_Info('Hello from Python ctypes', 'smoke')
Architecture and focused how-to scenarios
The last group answers specific questions that come up once the basics work.
Runtime packages (DelphiVCLWithPackages/) demonstrates that ExeWatch works with Delphi BPLs loaded dynamically via LoadPackage. The trick is compiling the SDK into its own package (ExeWatchSDKPkg.bpl) so the global EW instance, breadcrumbs, tags and user identity are genuinely shared across the host EXE and every module BPL. Two demo modules (Customers, Orders) log, time and capture errors using the exact same API as a regular app. Reach for it when you have a modular, plugin-style Delphi application.
// HostApp: initialize once; the SDK lives in ExeWatchSDKPkg.bpl, shared with every module
InitializeExeWatch(TExeWatchConfig.Create(APP_API_KEY, APP_CUSTOMER_ID));
EW.SetTag('app_type', 'runtime_packages');

// inside a dynamically loaded module BPL - same global EW, no extra setup
EW.Info('Customer added: ' + CustomerName, 'customers');
Breadcrumbs usage (SpecificScenarios/BreadcrumbsUsage/) settles the three most common breadcrumb questions in one project: scatter breadcrumbs where actions happen (don’t batch them), unhandled exceptions attach them automatically while caught ones need your EW.Error call, and only Error and Fatal logs carry breadcrumbs (Info / Warning / Debug do not). Four buttons make each rule visible in the dashboard. Reach for it when you want to get breadcrumbs right the first time.
EW.AddBreadcrumb(btClick, 'ui', 'Clicked "Save" button');
try
  FakeSaveToDatabase;   // raises
except
  on E: Exception do
    EW.ErrorWithException(E, 'settings');  // breadcrumbs auto-attach to this Error
end;
Initial custom device info (SpecificScenarios/InitialCustomDeviceInfo/) answers a subtle startup problem: how do you attach tags and environment metadata (RDP session, Terminal Server, desktop mode) to the very first event, the one emitted during initialization? The answer is two config fields, GlobalTags for data you filter logs by and InitialCustomDeviceInfo for details that describe the device. Reach for it when you need context present from the first log line.
Config := TExeWatchConfig.Create(EXEWATCH_API_KEY, 'SampleCustomer');
Config.GlobalTags := [TPair<string, string>.Create('session_type', SessionType)];
Config.InitialCustomDeviceInfo := [
  TPair<string, string>.Create('screen_res',  DetectScreenResolution),
  TPair<string, string>.Create('color_depth', DetectColorDepth)];
InitializeExeWatch(Config);   // tags present from the very first event
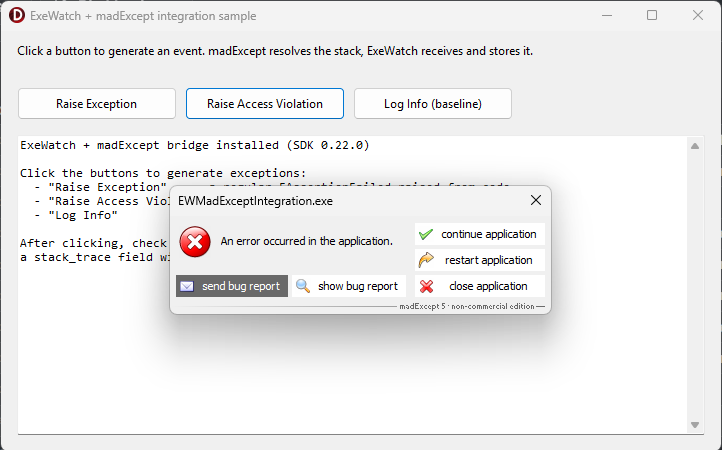
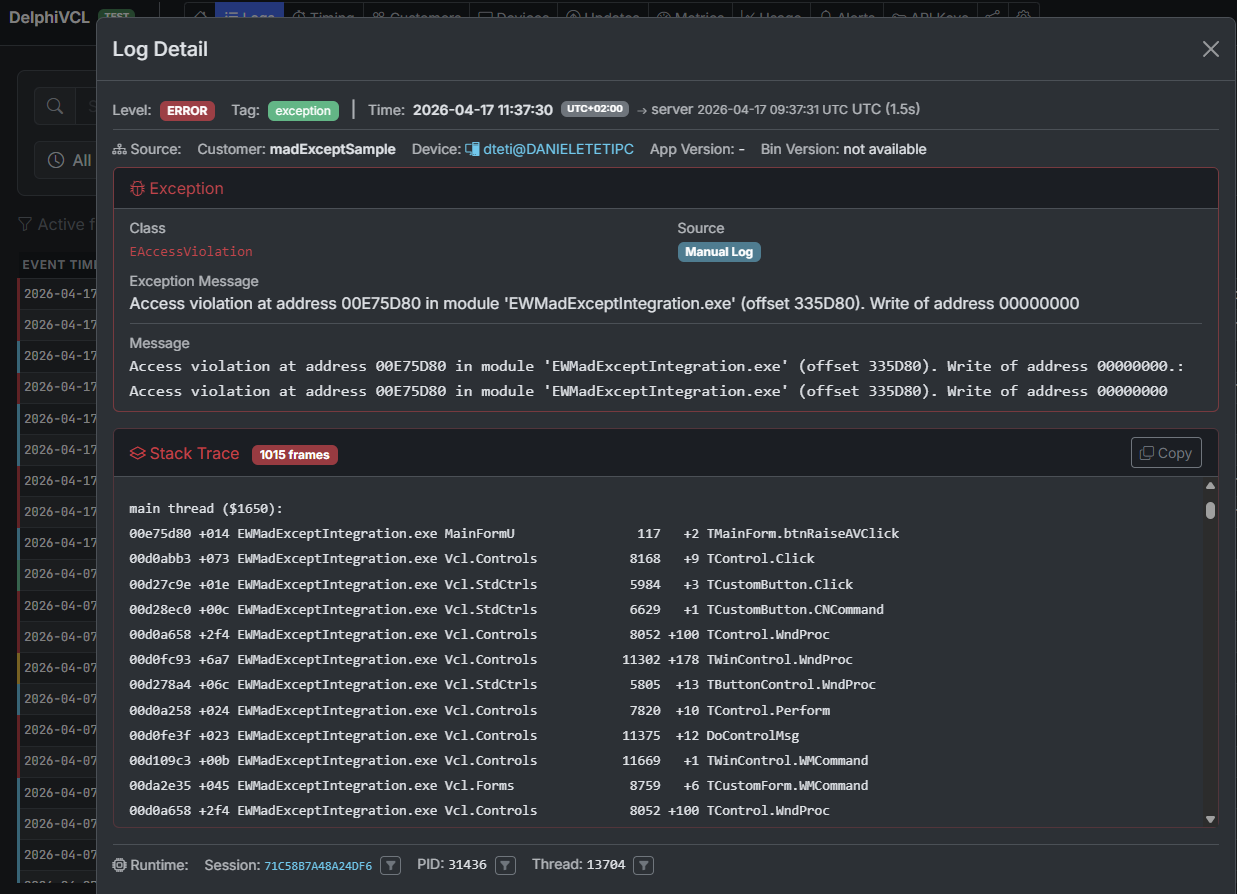
madExcept integration (SpecificScenarios/madExceptIntegration/) is for shops that already use madExcept. A single bridge unit registers a madExcept callback and forwards each exception to ExeWatch with madExcept’s already-symbolicated stack (unit names and line numbers) instead of the raw addresses the SDK would capture in a release build. It also shows the EurekaLog equivalent. Reach for it when you want searchable, readable stacks in the dashboard and already pay for symbolication at link time.
procedure ExeWatchMadExceptHandler(const ExceptIntf: IMEException; var Handled: Boolean);
var ExtraData: TJSONObject;
begin
  ExtraData := TJSONObject.Create;
  ExtraData.AddPair('stack_trace', ExceptIntf.BugReport);  // madExcept's resolved stack
  EW.Log(llError, ExceptIntf.ExceptMessage, 'exception', ExtraData);
end;

initialization
  RegisterExceptionHandler(ExeWatchMadExceptHandler, stDontSync);
One API, many runtimes
The reason a tour like this stays short is that the API is intentionally the same everywhere. Initialize, Info / Warning / Error, AddBreadcrumb, StartTiming / EndTiming, SetUser, SetTag, IncrementCounter / RecordGauge, and automatic exception capture: the spelling shifts a little between Delphi, C#, JavaScript and the C DLL, but the concepts and the dashboard are identical. Learn it in one sample and you know it in all of them.
Clone the repo, pick the project closest to your stack, drop in your key, and you will have real data in front of you in a couple of minutes.
Links and Resources
- Samples repository: github.com/danieleteti/ExeWatchSamples
- Official site: exewatch.com
- Documentation: exewatch.com/ui/docs
- Pricing & On Premise: exewatch.com/ui/pricing
- Changelog: exewatch.com/ui/changelog
- On Premise contact: exewatch@bittime.it
- Related article: ExeWatch 1.35: Nested Timing Traces, hierarchical profiling for your operations
ExeWatch: Application Performance Monitoring for server, desktop and web applications, with a built-in Artificial Intelligence Engine. Created by bit Time Professionals.
Comments
comments powered by Disqus