ExeWatch 1.35: Nested Timing Traces for Delphi & .NET
🇮🇹 Italiano • 🇩🇪 Deutsch • 🇪🇸 Español • 🇧🇷 Português
Nested Timing Traces turn ExeWatch timings into a profiler-style call tree: StartTrace, EndTrace, a single-trace waterfall and an aggregated Calling-Context-Tree, on every SDK (Delphi, .NET, Python, JavaScript and the DLL for C++Builder and MSVC).
TL;DR: ExeWatch 1.35 introduces Nested Timing Traces: nested timings as a tree, profiler-style. Open a trace with
StartTrace, run the usualStartTiming/EndTiminginside it (across multiple levels too), close it withEndTrace. ExeWatch reconstructs the hierarchy at read time and shows it in two views: the waterfall of a single execution and the aggregated tree (Calling-Context-Tree) of every execution of an operation. A uniform API across Delphi, .NET, Python, JavaScript and the DLL for C++Builder/MSVC, and full backward compatibility with your existing flat timings. Try it on exewatch.com
ExeWatch is growing, and growing fast
Let’s start with good news: ExeWatch is growing a lot. In just a few months we are already at hundreds of users monitoring their desktop, server and web applications in production - and the community keeps expanding week after week, across Delphi, C++Builder, .NET, JavaScript and Python developers.
What makes us proudest is that every release comes from the feedback of people who use ExeWatch every day. 1.35 is no exception: Nested Timing Traces are one of the most requested features since ExeWatch was born, and they are finally here.
From a single timing to a tree
Timings have always been one of the most loved tools in ExeWatch: StartTiming('LoadCustomers') … EndTiming('LoadCustomers'), and the dashboard immediately gives you average duration, p95, count and trend for every operation. They are the fastest, most direct way to measure performance, they remain the heart of the product and they keep working exactly as before.
Sometimes, though, an important operation is made of many nested steps, and beyond how long it takes you also want to see how it is made inside. When GenerateInvoiceReport takes 250 ms, it is nice to be able to drill down one level: how do those 250 ms split across data loading, rendering and maybe a loop that repeats the same function? Nested Timing Traces add exactly that dimension - the hierarchy - on top of the timings you already use, without taking anything away.
The idea is simple and follows the profiler and distributed-tracing model: a trace is a tree of spans, where each span is a timed operation with a parent. The twist is that in ExeWatch every span is simply a timing log event enriched with trace_id, span_id and parent_span_id. Spans are streamed, each one as it closes, and the tree is reconstructed at read time by the backend. No structure to hold in memory on the client side, no assembly at ingest time: just logs, as always.
The API: StartTrace / EndTrace
The interface adds only two primitives, consistent with the StartTiming/EndTiming you already know. Example in Delphi:
EW.StartTrace('GenerateInvoiceReport');
try
  EW.StartTiming('LoadCustomers', 'db');
  // ... load the data ...
  EW.EndTiming('LoadCustomers');

  EW.StartTiming('RenderReport', 'cpu');
  EW.StartTiming('RenderRow', 'cpu');   // child of RenderReport
  // ...
  EW.EndTiming('RenderRow');
  EW.EndTiming('RenderReport');
finally
  Total := EW.EndTrace;   // total trace duration, in ms
end;
You don’t declare the nesting: ExeWatch infers it. Each SDK keeps a per-thread LIFO stack; when you open a timing inside an active trace, that timing automatically becomes a child of the operation currently on top of the stack. Open a StartTrace while a trace is already active and it gracefully degrades to a child span (it returns the id of the trace already in progress); forget an EndTiming and EndTrace force-closes the still-open spans, marking them as failed instead of losing them.
The same API, with the same semantics, is available on native Delphi, .NET, Python, JavaScript and on the native DLL that brings ExeWatch to C++Builder and Microsoft Visual C++. A trace written in Python and one written in C++Builder produce the same tree in the dashboard.
View 1: the single-trace waterfall
In the log list, a trace is easy to spot: the root row is marked with the tree icon and the [TRACE] label. A click opens the waterfall, the exact hierarchy of that single execution.
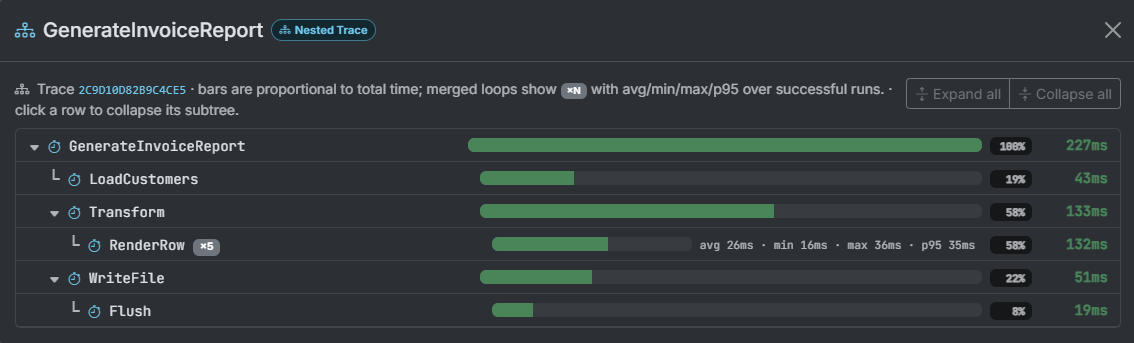
Each node shows its duration, a bar proportional to the total time and the percentage relative to the root (with the “X% of parent” detail in the tooltip). Operations repeated at the same level - a timing inside a loop - are merged into a single row with a ×N badge and the average / min / max / p95 statistics over the successful executions. The tree is expandable and collapsible: keep open what you care about, collapse the branches you are not looking at right now.
View 2: the aggregated tree (Calling-Context-Tree)
The waterfall tells you about one run. But to hunt down a performance regression you need the big picture: how does that operation behave across all its executions? That’s why, on the Timings page, operations that are trace roots open a second view - the aggregated tree, a Calling-Context-Tree.
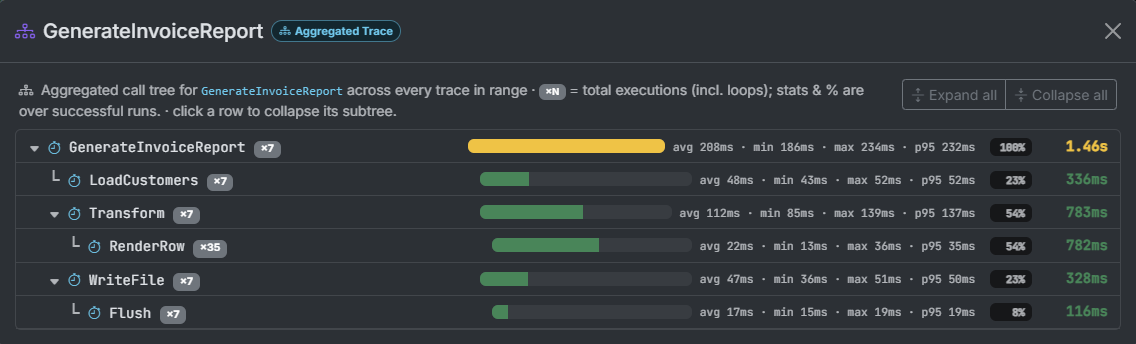
It is the classic profiler technique. Every execution of an operation follows a call path; the aggregated tree merges spans by path, not just by name. Executions that follow the same path collapse into a single node - with the cumulative count of every execution, loops included - while a path that diverges in some runs branches off into its own node. The result is a single tree that tells you, for each node, count, average, minimum, maximum and p95 aggregated over hundreds of executions. Where the time goes, on average, stops being guesswork.
Total backward compatibility
A rule we hold dear at ExeWatch: nothing breaks. Nested Timing Traces are completely additive.
- Your existing flat timings keep appearing exactly as before, both in the log list and in the Timings page aggregates. A child span does not pollute the top-level views: it shows up only in the drill-down of its trace.
- Older SDK versions keep working unchanged. The tracing API is new, but anyone who doesn’t use it won’t even notice.
- For the DLL (C++Builder/MSVC) we made the upgrade as smooth as possible: a newer DLL works even under an older import unit, so updating the library doesn’t force a coordinated recompilation.
To start using traces you simply update the SDK from the Integration page of the dashboard and add StartTrace/EndTrace around the operations you want to profile. The rest of your logging code stays as it is.
If you already use ExeWatch, Nested Timing Traces are already active on your account: update the SDK and start tracing. If you haven’t tried it yet, the Hobby plan is free and requires no credit card.
Frequently Asked Questions about Nested Timing Traces
What are ExeWatch Nested Timing Traces?
They are nested timings organized as a tree, just like in a profiler. You open a trace with StartTrace, run the usual StartTiming/EndTiming inside it (nested across as many levels as you like), and close it with EndTrace. ExeWatch reconstructs the parent-child hierarchy at read time and shows it as a waterfall: every operation with its duration, its percentage of the total and any loops merged together.
Are Nested Timing Traces available on every SDK?
Yes. The StartTrace/EndTrace API is uniform across the native Delphi SDK, .NET, Python, JavaScript and the native DLL used by C++Builder and Microsoft Visual C++. The semantics are identical everywhere: a per-thread LIFO stack determines nesting, a StartTrace inside an already-active trace degrades to a child span, and EndTrace force-closes any forgotten spans.
What is the difference between the single-trace waterfall and the aggregated tree?
The waterfall shows a single execution: the exact hierarchy of that one run. The aggregated tree (Calling-Context-Tree) merges every execution of the same operation by grouping them by call path: paths that diverge become separate branches, loops and repeated executions accumulate, and for each node you see count, average, minimum, maximum and p95. It is the profiler view that tells you where the time actually goes.
Do I need to upgrade the backend or change my existing code?
No. Nested Timing Traces are fully backward compatible. Your existing flat timings keep working and keep appearing exactly as before, both in the log list and on the Timings page. Older SDK versions keep working unchanged: tracing is additive. To start using it you simply update the SDK and add StartTrace/EndTrace around the operations you want to profile.
How are loops and repeated operations handled?
When the same operation runs several times at the same level (for example a timing inside a loop), ExeWatch merges it into a single node with a ×N badge and shows average, minimum, maximum and p95 over the successful executions. That way a ten-thousand-iteration loop stays readable as a single row, without flooding the waterfall.
Are Nested Timing Traces included in every plan?
Yes. Like every core ExeWatch feature, Nested Timing Traces are available on every plan, including the free Hobby plan. No credit card is required to try them.
Links and Resources
- Official site: exewatch.com
- Full changelog: exewatch.com/ui/changelog
- Pricing & On Premise: exewatch.com/ui/pricing
- Integration samples: github.com/danieleteti/ExeWatchSamples
- On Premise contact: exewatch@bittime.it
- Previous articles:
ExeWatch: Application Performance Monitoring for server, desktop and web applications, with a built-in Artificial Intelligence Engine. Created by bit Time Professionals.
Comments
comments powered by Disqus