ExeWatch 1.30: SDKs for C++Builder, MSVC and pre-XE8 Delphi, Global Tags and per-Customer Alerts
🇮🇹 Italiano • 🇩🇪 Deutsch • 🇪🇸 Español • 🇧🇷 Português
TL;DR: ExeWatch 1.30 adds native support for C++Builder, Microsoft Visual C++ and Delphi versions 4 through XE7 via a new DLL-based SDK. It introduces global tags inherited automatically on every log and per-customer alert filtering. It also adds
WaitForSendingto explicitly wait for queued logs to be shipped, thread-local timings, per-application file queue isolation and email notifications at 80% and 100% of the monthly event quota. Everything included on every plan. Try it at exewatch.com
Release highlights
- 🆕 New DLL-based SDK for C++Builder, Microsoft Visual C++ (MSVC), MinGW, Clang and Delphi 4–XE7
- 🏷️ Global Tags: key-value pairs inherited automatically on every log of the session (native Delphi + JavaScript)
- 🎯 Per-Customer-ID alert filter: log-level and timing alert rules scopable to a single customer
- ⏱️
WaitForSendingon every SDK: API to explicitly wait for the log queue to drain - 🧵 Thread-local timings on Delphi, .NET and Python: each thread keeps its own timing stack
- 📁 Per-application file queue isolation: dedicated subdirectory identified by the API key
- 📧 Email notifications on monthly event quota: warning at 80%, hard limit at 100%
- 🚀 DLL ABI bumped to version 3 to reflect
WaitForSending
A release that widens the perimeter
Since ExeWatch was first launched, the community response has exceeded any of our predictions. Every week we get integration requests, reports of use cases we had never imagined, and above all questions of the form “is your SDK available for …?”. It’s the most direct confirmation that a product like ExeWatch was needed and demanded by developers who write applications that run “outside the browser”: Delphi and C++Builder developers first and foremost, but in general everyone who builds desktop software, Windows services, industrial applications and technical tooling, that world where production logs are historically hard to obtain and where cloud-native APMs built for microservices simply don’t fit.
ExeWatch’s release path has followed a precise arc: first the consolidation of the core (logging, timing, breadcrumbs, device info), then the extension to new languages (Delphi, then .NET, JavaScript, Python), and finally the maturing of “product” features (custom metrics, health monitoring, usage analytics).
With 1.30 we take another important step in two directions that intertwine:
- More languages and environments natively supported: support for C++Builder and Microsoft Visual C++ arrives via the new DLL-based SDK. The same mechanism also opens ExeWatch to Delphi versions 4 through XE7 (the native Delphi SDK
ExeWatchSDKv1.passtill requires Delphi XE8 or later). - More fine-grained control over existing features: global tags inherited on every log, per-customer alert filter, explicit handling of shutdown, per-application isolation.
These additions mostly come from feedback from enterprise customers who are running ExeWatch in production on significant fleets. Once integrated, however, they have been made available on every plan, from the free Hobby up to Business.
DLL-based SDK: legacy Delphi, C++Builder and Microsoft Visual C++
By a wide margin, the most frequent request we have received since ExeWatch launched is “can I use it with Delphi versions earlier than XE8?”. The native SDK ExeWatchSDKv1.pas relies on language features (generics, anonymous methods, dotted namespaces) that are not available on older compilers, and Delphi 4, 5, 6, 7, 2007, 2009, 2010 are still in production today across significant fleets, especially in industrial, business and scientific software.
The answer in 1.30 is a new DLL-based SDK that completely decouples the client compilation from the user project’s compiler. The logic lives inside ExeWatchSDKv1DLL.dll (shipped in two variants, 32-bit and 64-bit) and the user project links to it through a dedicated import unit, ExeWatchSDKv1Imports.pas, that works from Delphi 5 onwards. The import unit resolves internally the differences between AnsiString and WideString, between older and modern namespaces, between IInterface and IUnknown.
// Delphi 5, 6, 7, 2007 and 2009: same code, same API
uses
  ExeWatchSDKv1Imports;

procedure InitMyApp;
begin
  ew_Initialize('ew_win_your_key', 'ACME-Corp', '1.0.0');
  ew_Info('App started', 'startup');
end;
Once the DLL mechanism was in place, exposing it to a second world was a natural step: C++Builder and Microsoft Visual C++ (MSVC). The DLL is a standard Windows binary, callable from any language able to call C functions. We pair it with a C header usable either with static link or with dynamic loading via LoadLibrary, and a ready-made loader to drop into the project:
// ExeWatchSDKv1.h: static link or dynamic load
#include "ExeWatchSDKv1.h"

int main(int argc, char** argv) {
    EWConfig cfg = {0};
    cfg.api_key      = "ew_win_your_key";
    cfg.customer_id  = "ACME-Corp";
    cfg.app_version  = "1.0.0";

    if (ew_Initialize(&cfg) != EW_OK) {
        fprintf(stderr, "ExeWatch init failed\n");
        return 1;
    }

    ew_Info("MSVC console starting", "startup");

    ew_StartTiming("invoice.generate", "pdf");
    // ... actual work ...
    ew_EndTiming("invoice.generate");

    ew_WaitForSending(5);  // wait for flush before exiting (max 5s)
    ew_Shutdown();
    return 0;
}
The same header with the same loader works indistinguishably with C++Builder, MSVC, MinGW and Clang on Windows. No special build systems or external dependencies are required: the DLL is self-contained and from the project side a single .c file is enough (the header ExeWatchSDKv1.h and the loader implementation, already provided).
Operationally, the DLL ABI has moved to version 3, aligned with the new WaitForSending API. Users on version 2 simply need to update the DLL and the import unit together: the existing call schema does not change.
Global Tags: cross-cutting dimensions on every log
The classic tags in ExeWatch (tag on logs, tag on timings) are by definition contextual: they describe the single event. But many scenarios require cross-cutting dimensions that apply to the entire session of an application: the tenant it is running for, the region, the build flavor, the environment, the product variant.
Until now the standard workaround was to include this information inside customer_id or extra_data. It worked, but it was repetitive and, above all, it could not be filtered in a structured way from the dashboard.
In 1.30 the Global Tags arrive, supported on the native Delphi SDK and the JavaScript SDK. You declare them once when initialising and they are automatically appended to every log:
// Delphi
InitializeExeWatch(
  EXEWATCH_API_KEY,
  ACustomerId    := 'ACME-Corp',
  AGlobalTags    := [
    TPair<string, string>.Create('tenant',     'EU-North'),
    TPair<string, string>.Create('flavor',     'Pro-Edition'),
    TPair<string, string>.Create('deployment', 'kiosk')
  ]
);
// JavaScript
ExeWatch.init({
  apiKey: 'ew_web_your_key',
  customerId: 'ACME-Corp',
  globalTags: {
    tenant: 'EU-North',
    flavor: 'Pro-Edition',
    deployment: 'kiosk'
  }
});
From that moment on, every log sent by the application carries the three tags. In the Logs page of the dashboard you will find a Global Tags filter that lets you see, for example, only logs from the EU-North tenant with the Pro-Edition flavor:
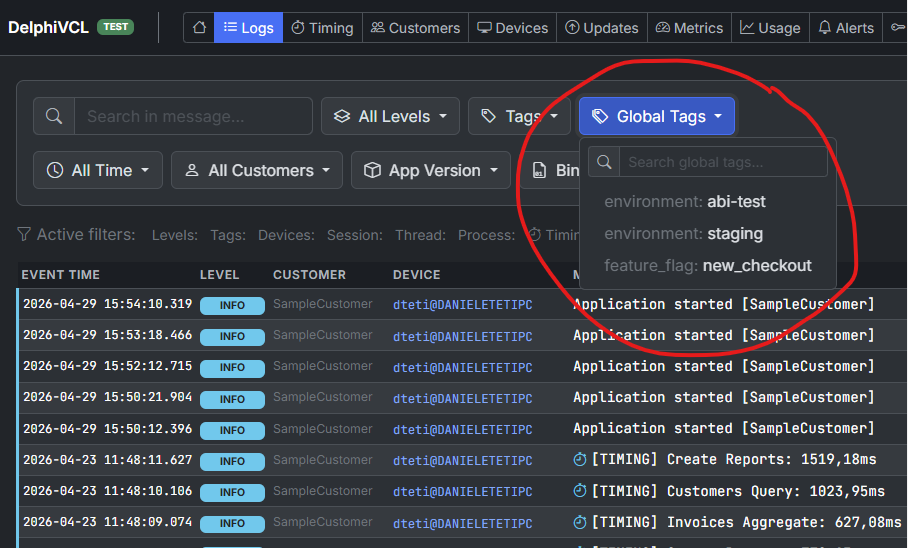
The "Global Tags" dropdown in the ExeWatch Logs page lists all key/value pairs received from the SDK and lets you slice the timeline at a glance.
It is exactly the missing dimension for those managing multi-tenant installations or differentiated releases.
Per-Customer-ID alert filter
Still in the same “fine control” spirit, we have added an optional Customer ID filter to both log-level and timing alerts.
The scenario is familiar: you have a fleet of 500 installations, one of them (perhaps a new customer with a particular setup) generates recurring errors. If you lower the global threshold you receive 20 notifications per day from the rest of the fleet. If you leave it high, you miss the problem on the specific customer.
With the per-customer filter you can have both: a “global” tolerant rule and a customer-specific rule with a low threshold and a short cooldown. When you create or modify an alert, you will see a new optional field Filter by Customer: left on the default All Customers option the rule applies to the whole fleet, while picking a specific Customer ID makes the rule fire only for that customer.
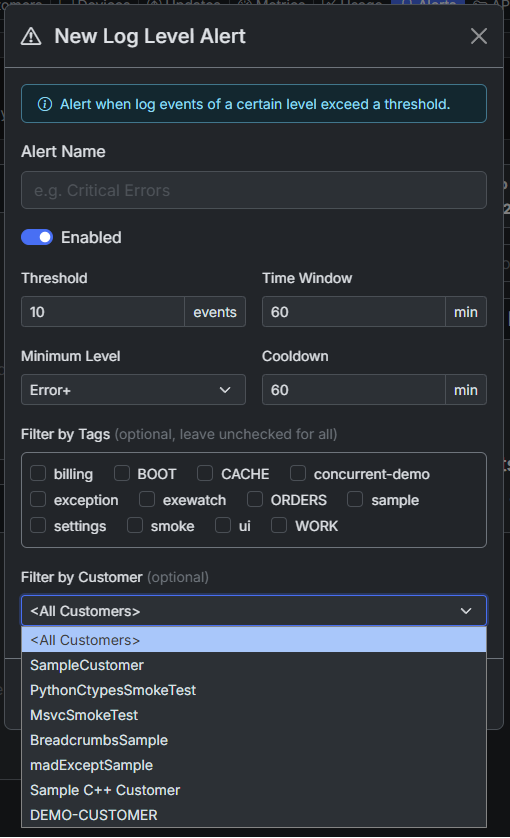
The new "Filter by Customer" field in the Log Level Alert creation dialog. The same field is also available on Timing Alerts, with the same behaviour.
The filter is available on both Log Level Alerts and Timing Alerts, with the same logic: if populated with a Customer ID, the rule fires only when the event (error or slow timing) comes from that customer; if left on the default All Customers, the rule applies to the entire fleet. It is also useful for the opposite pattern: receiving notifications only from pilot customers during a gradual rollout of a new version.
WaitForSending: explicit flush wait
ExeWatch’s log shipping is asynchronous by design: logging never blocks the caller, and a dedicated thread is in charge of sending the batches to the server in the background. For VCL, FMX, WPF, WinForms applications or for long-running services this choice is ideal: the final flush is handled automatically in Shutdown when the main loop terminates in a controlled fashion.
There are however scenarios in which the caller wants to know the queue has drained before proceeding: CLI scripts that exit right after logging an error, nightly batch jobs, E2E test sessions that must propagate logs before closing the browser, finalisation of a Windows Service in response to a stop request. In all these cases 1.30 introduces a uniform API across every SDK named WaitForSending:
// Delphi, end of a console app
EW.Fatal('Unrecoverable error: ' + E.Message, 'startup');
EW.WaitForSending(5);  // wait up to 5 seconds
ExitCode := 1;
// C#, end of a Windows Service
EW.Fatal("Service stopping due to fatal error", "lifecycle");
EW.WaitForSending(5);
ExeWatchSdk.Shutdown();
// JS, before closing/reloading the page
ew.fatal("Unrecoverable client error", "ui");
await ew.waitForSending(5);
# Python, end of a CLI script
ew.fatal("Job failed", "batch")
ew.wait_for_sending(5)
The return value is the number of items still in the queue when the timeout expired: zero means “everything shipped successfully”.
Thread-local timings
Timing measurements (StartTiming / EndTiming) are among the most-used features in the SDK because they let you profile code in production at virtually zero cost. Until 1.30, in heavily multi-threaded applications, two workers using the same timing id on different threads shared the same internal “slot”. In edge cases this could produce less precise measurements than you would expect.
With this release the SDK maintains a per-thread timing stack. Every thread holds its own independent map of pending timers, and timers with the same id on different threads are completely isolated. The internal behaviour changes; the public API does not. The change is available on Delphi, .NET and Python (browser JavaScript is single-threaded by nature, and Web Workers already have an isolated context):
// Delphi: each thread now keeps its own timing stack
// Note: always wrap StartTiming/EndTiming in try..finally
// so the timer is closed even if DoHeavyWork raises an exception.
TThread.CreateAnonymousThread(
  procedure
  begin
    EW.StartTiming('worker.process', 'background');
    try
      DoHeavyWork;
    finally
      EW.EndTiming('worker.process');  // closes the timer for THIS thread
    end;
  end).Start;

TThread.CreateAnonymousThread(
  procedure
  begin
    EW.StartTiming('worker.process', 'background');  // OK, does not collide
    try
      DoHeavyWork;
    finally
      EW.EndTiming('worker.process');
    end;
  end).Start;
The logical id of the timing stays identical: in the dashboard worker.process keeps aggregating the executions of both threads correctly. But internally each thread holds its own “slot” and the timers do not step on each other.
JavaScript SDK: full HTTP error capture
On the JavaScript SDK we have two additions that change the quality of error information you collect in production.
The first: every time a fetch or XMLHttpRequest returns a >= 400 status, the SDK automatically captures the response body and attaches it as extra_data. That means alongside the status code you also get the error message returned by the backend, which is almost always the key to understanding what went wrong.
The second: a new callback httpErrorExtractor that lets you customise what gets attached:
ExeWatch.init({
  apiKey: 'ew_web_your_key',
  httpErrorExtractor: (body, contentType, status, url) => {
    if (contentType?.includes('json')) {
      try {
        const parsed = JSON.parse(body);
        return {
          message: parsed.detail || parsed.error || `HTTP ${status}`,
          extra: { trace_id: parsed.trace_id }
        };
      } catch (_) { /* fall through */ }
    }
    return null;  // use raw body as the default
  }
});
Useful when your backend exposes a structured error payload (e.g. FastAPI with {"detail": "...", "trace_id": "..."}) and you want ExeWatch to log it in the same format you would use in your server-side observability dashboard.
Per-application file queue isolation
Invisible detail, important consequence. On a machine where multiple ExeWatch applications run (typically a primary user-facing application plus an auxiliary Windows service, or two product variants on the same workstation), so far the offline storage directory was unique by default and isolation required passing different paths manually in each SDK configuration.
From 1.30 each application that initialises the SDK automatically creates a dedicated subdirectory keyed by the API key. Multiple applications can now coexist on the same storage directory in complete safety, with no extra configuration required.
Email notifications on event quota
The free Hobby plan includes 5,000 events per month, Pro 100,000, Business 1,000,000. Starting from 1.30, the account owner and team members receive an email when two thresholds are reached:
- 80% of the monthly quota (warning): there is still time to act before the block
- 100% of the monthly quota (limit reached): further logs are not accepted until the monthly reset
The quota itself remains visible in the dashboard, but the email is the signal many users were waiting for: it reaches you where you look every day and lets you act (lowering the SDK minimum log level, applying filters or planning the upgrade) before the issue becomes a block.
Pricing and On Premise
The pricing page has gained a fourth plan alongside Hobby, Pro and Business: On Premise. It is not a self-service plan, and never will be: each on-premise ExeWatch installation has specific needs in terms of sizing, backup, retention and support. That’s why we have a direct conversation with the people who need it.
The most common scenarios are the expected ones: companies whose internal policies forbid sending telemetry data to a managed service, regulatory contexts (GxP, healthcare, defense), or simple latency needs when the application is geographically far from our European datacentre.
The on-premise offering includes everything in Business (including the AI Engine Full) plus unlimited applications, events, retention, alerts and team members, custom integrations, dedicated onboarding and a negotiated SLA. For details: exewatch@bittime.it.
Videos and webinars
If you want to see ExeWatch “in motion” before trying it, three videos are available on YouTube depending on language and stack of interest:
-
🇮🇹 ExeWatch: Proactive Software Monitoring (in Italian): a conversation between Daniele Teti and Fabrizio Bitti about the genesis of the product, the design decisions and typical use cases. It’s the “human” presentation of the project, useful before getting hands dirty.
-
🇬🇧 ExeWatch: Stop Waiting for Crash Reports and Start Solving Problems (in English): the international version, aimed at viewers looking for a concise English overview of the benefits of proactive monitoring over the traditional “wait for the customer to call” model.
-
🇮🇹 Cosa succede alla tua app .NET in produzione? Scoprilo con ExeWatch! (Live Coding) (in Italian), live by Marco Breveglieri specifically aimed at .NET / C# developers: step-by-step integration of ExeWatch in a C# solution directly from Visual Studio, with live code. The fastest path to start if your stack is Windows + .NET.
For Spanish-speaking audiences, an ExeWatch webinar in Spanish is already scheduled for Wednesday 20 May 2026, organised together with Delphi Studio. To register, simply fill in this registration form.
Why ExeWatch keeps growing this way
Something that strikes me every time we ship a release with this many features: not one of these additions was born “alone” in front of a blank page. Every one is the result of a concrete conversation with someone running ExeWatch in production.
C++Builder and MSVC support came from industrial customers with critical legacy C++ code in production. Global Tags came from a customer with multi-tenant installations. The per-customer alert filter arrived after a phone call where a customer told me “I have a heavy user flooding me with alerts but I can’t raise the threshold for the others”. WaitForSending is a need that emerged talking with someone running nightly batch jobs on the CLI.
This is also why all these features (including those “sponsored” by enterprise customers) are available on the free Hobby plan as well. The patterns that emerge at scale eventually reach smaller projects too: better to have them ready when they’re needed.
What’s next
It’s worth recalling that the native Delphi SDK already compiles and runs on Delphi for Windows, Delphi for Linux and Delphi for Android: anyone building FireMonkey applications for the mobile world has ExeWatch available right now, with no need to wait for a separate SDK. The next step in that direction is to close the circle with native SDKs independent from the Delphi toolchain, for developers building mobile with different stacks (Kotlin/Java for native Android, Swift for iOS).
On the backend side we are working to extend the AI Engine to a third analysis dimension: not just errors and timings, but also usage patterns (sessions, traffic surges, usage peaks). The goal is for the dashboard to tell you “something has changed” even when the change is not an error, but an anomalous variation in the way your customers use the product.
If you already use ExeWatch, every 1.30 feature is already active on your account: there is nothing to do on the server side. To benefit from WaitForSending, Global Tags and the new C/C++ SDK, simply update the SDK on the application side from the Integration page of the dashboard.
If you haven’t tried it yet, the Hobby plan is free and requires no credit card: five minutes are enough for the first integration and typically the first logs reach the dashboard before you finish reading the guide.
Links and Resources
- Official site: exewatch.com
- Full changelog: exewatch.com/ui/changelog
- Pricing & On Premise: exewatch.com/ui/pricing
- Integration samples: github.com/danieleteti/ExeWatchSamples
- ExeWatch videos:
- On Premise contact: exewatch@bittime.it
- Previous articles:
ExeWatch: Application Performance Monitoring for server, desktop and web applications, with a built-in Artificial Intelligence Engine. Built by bit Time Professionals.
Comments
comments powered by Disqus